Open Access
Fig. 8.
Download original image
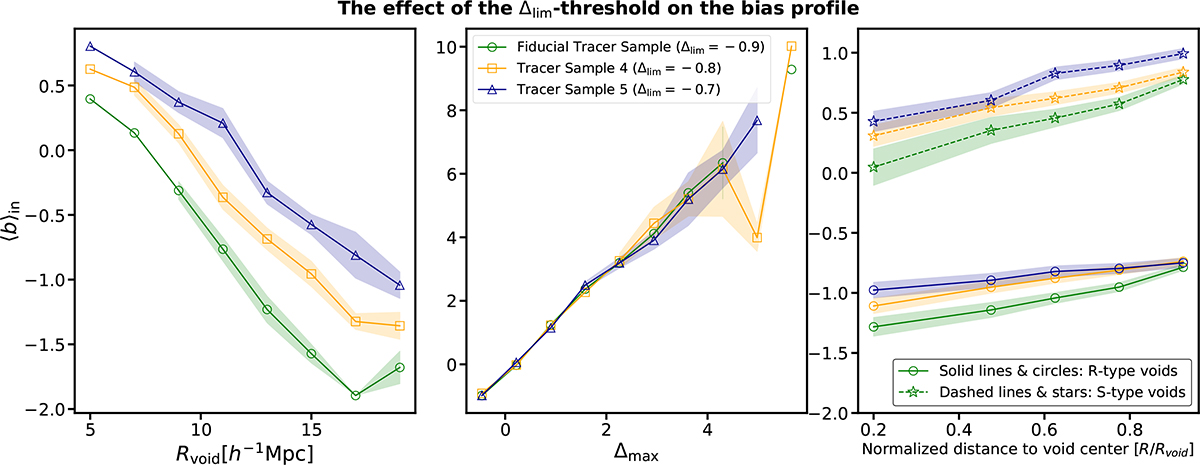
Same as Fig. 7 but varying the overdensity threshold, Δlim – one of the main parameters used to define voids. The green lines and symbols show again the fiducial sample (with Δlim = −0.9), whereas results for Δlim = −0.8 and −0.7 are represented in yellow and blue, respectively.
Current usage metrics show cumulative count of Article Views (full-text article views including HTML views, PDF and ePub downloads, according to the available data) and Abstracts Views on Vision4Press platform.
Data correspond to usage on the plateform after 2015. The current usage metrics is available 48-96 hours after online publication and is updated daily on week days.
Initial download of the metrics may take a while.