Fig. 1.
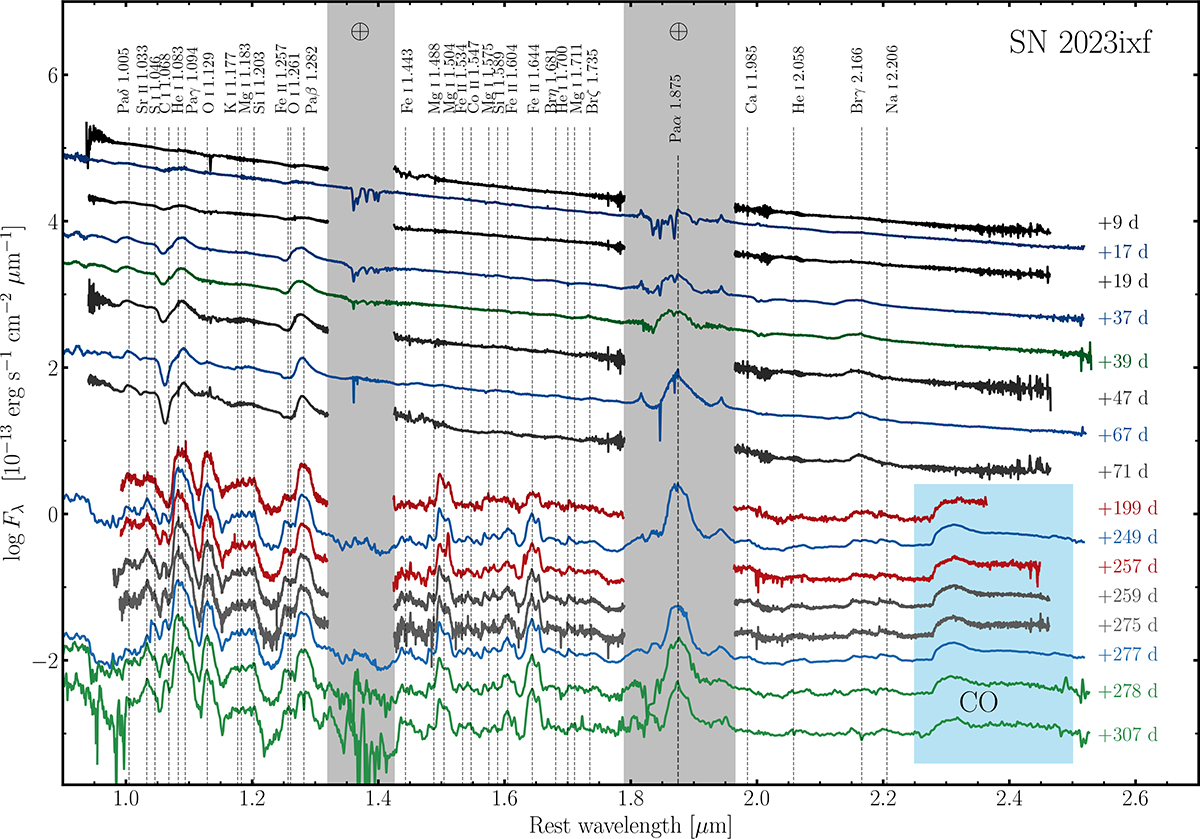
Download original image
Gemini/GNIRS (17, 37, 67, 249, and 277 d; blue), Keck/NIRES (9, 19, 47, 71, 259, and 275 d; black), IRTF/SpeX (39, 278, and 307 d; green), and MMT/MMIRS (199 and 257 d; red) spectra of SN 2023ixf in time order (top to bottom). Each spectrum is labeled with the days elapsed after the explosion. The wavelengths of known strong lines (e.g., Meikle et al. 1989) are marked with dotted lines. Regions with significant noise due to strong telluric absorption are shaded in gray. The wavelength region of the first overtone CO emission is shaded in light blue. We also include Paschen α (1.875 μm), which falls in a region of poor telluric transmission, marked by a black dotted line. The Brackett δ and ϵ lines, which also fall in the region, are artifacts due to incomplete removal of the same lines in the standard stars, despite appearing to be present in some of the spectra.
Current usage metrics show cumulative count of Article Views (full-text article views including HTML views, PDF and ePub downloads, according to the available data) and Abstracts Views on Vision4Press platform.
Data correspond to usage on the plateform after 2015. The current usage metrics is available 48-96 hours after online publication and is updated daily on week days.
Initial download of the metrics may take a while.