| Issue |
A&A
Volume 703, November 2025
|
|
|---|---|---|
| Article Number | A227 | |
| Number of page(s) | 15 | |
| Section | Astrophysical processes | |
| DOI | https://doi.org/10.1051/0004-6361/202555244 | |
| Published online | 20 November 2025 | |
Near-infrared spectroscopy and detection of carbon monoxide in the Type II supernova SN 2023ixf
1
Department of Physics and Astronomy, Seoul National University, Gwanak-ro 1, Gwanak-gu, Seoul 08826, South Korea
2
SETI Institute, 339 Bernardo Ave., Ste. 200, Mountain View, CA 94043, USA
3
Steward Observatory, University of Arizona, 933 North Cherry Avenue, Tucson, AZ 85721-0065, USA
4
National Astronomical Research Institute of Thailand, 260 Moo 4, Donkaew, Maerim, Chiang Mai 50180, Thailand
5
Department of Astronomy and Astrophysics, University of California, Santa Cruz, CA 95064, USA
6
Gemini Observatory/NSF’s National Optical-Infrared Astronomy Research Laboratory, 670 N. Aohoku Place, Hilo, HI 96720, USA
7
Department of Physics and Astronomy, University of California, 1 Shields Avenue, Davis, CA 95616-5270, USA
8
Department of Physics, Virginia Tech, Blacksburg, VA 24061, USA
9
Florida State University, Tallahassee, FL 32309, USA
10
Las Cumbres Observatory, 6740 Cortona Drive, Suite 102, Goleta, CA 93117-5575, USA
11
Department of Physics, University of California, Santa Barbara, CA 93106-9530, USA
12
Adler Planetarium, 1300 S. DuSable Lake Shore Dr., Chicago, IL 60605, USA
13
Space Telescope Science Institute, 3700 San Martin Drive, Baltimore, MD 21218-2410, USA
14
California Institute of Technology, Pasadena, CA 91125, USA
15
George P. and Cynthia Woods Mitchell Institute for Fundamental Physics and Astronomy, Department of Physics and Astronomy, Texas A&M University, College Station, TX 77843, USA
16
Planetary Science Institute, 1700 East Fort Lowell Road, Suite 106, Tucson, AZ 85719-2395, USA
17
Hamburger Sternwarte, Gojenbergsweg 112, D-21029 Hamburg, Germany
18
Homer L. Dodge Department of Physics and Astronomy, University of Oklahoma, Norman, OK 73019-2061, USA
19
Rutgers Department of Physics and Astronomy, 136 Frelinghuysen Rd, Piscataway, NJ 08854, USA
20
Institute of Space Sciences (ICE-CSIC), Campus UAB, Carrer de Can Magrans, s/n, E-08193 Barcelona, Spain
21
Institut d’Estudis Espacials de Catalunya (IEEC), 08860 Castelldefels (Barcelona), Spain
⋆ Corresponding authors: This email address is being protected from spambots. You need JavaScript enabled to view it.
, This email address is being protected from spambots. You need JavaScript enabled to view it.
, This email address is being protected from spambots. You need JavaScript enabled to view it.
Received:
22
April
2025
Accepted:
24
September
2025
Abstract
Context. Core-collapse supernovae (CCSNe) may have contributed a significant amount of dust in the early Universe. Freshly formed coolant molecules (e.g., CO) and warm dust can be found in CCSNe as early as ∼100 d after the SN explosion, allowing the study of their evolution with time series observations.
Aims. Through study of the Type II SN 2023ixf, we aim to investigate the temporal evolution of the temperature, velocity, and mass of CO and compare them with other CCSNe, exploring their implications for the dust formation in CCSNe. From observations of velocity profiles of lines of other species (e.g., H and He), we also aim to characterize and understand the interaction of the SN ejecta with preexisting circumstellar material (CSM).
Methods. We present a time series of 16 near-infrared spectra of SN 2023ixf from 9 to 307 d, taken with multiple instruments: Gemini/GNIRS, Keck/NIRES, IRTF/SpeX, and MMT/MMIRS.
Results. The early (t ≲ 70 d) spectra indicate interaction between the expanding ejecta and nearby CSM. At t ≲ 20 d, intermediate-width line profiles corresponding to the ejecta-wind interaction are superposed on evolving broad P Cygni profiles. We find intermediate-width and narrow lines in the spectra until t ≲ 70 d, which suggest continued CSM interaction. We also observe and discuss high-velocity absorption features in H α and H β line profiles formed by CSM interaction. The spectra contain CO first overtone emission between 199 and 307 d after the explosion. We modeled the CO emission and found the CO to have a higher velocity (3000–3500 km s−1) than that in Type II-pec SN 1987A (1800–2000 km s−1) during similar phases (t = 199 − 307 d) and a comparable CO temperature to SN 1987A. A flattened continuum at wavelengths greater than 1.5 μm accompanies the CO emission, suggesting that the warm dust is likely formed in the ejecta. The warm dust masses are estimated to be on the order of ∼10−5 M⊙.
Key words: dust, extinction / supernovae: individual: SN 2023ixf / infrared: stars
LSST-DA Catalyst Fellow.
© The Authors 2025
 Open Access article, published by EDP Sciences, under the terms of the Creative Commons Attribution License (https://creativecommons.org/licenses/by/4.0), which permits unrestricted use, distribution, and reproduction in any medium, provided the original work is properly cited.
This article is published in open access under the Subscribe to Open model. This email address is being protected from spambots. You need JavaScript enabled to view it. to support open access publication.
1. Introduction
Located in the M101 galaxy, SN 2023ixf is one of the nearest (d = 6.85 ± 0.15 Mpc; Riess et al. 2022) Type II supernova (SN II) found during the past several decades and is one of the best-studied SNe since its discovery. SN 2023ixf was reported by Itagaki (2023) on 2023 May 19 at 21:42 UT and was spectroscopically classified by Perley et al. (2023). The estimated explosion time is 2023 May 18 18:00:00 (MJD 60082.75 ± 0.10; Hosseinzadeh et al. 2023).
The progenitor of SN 2023ixf identified from pre-explosion imaging was a red supergiant (RSG; e.g., Jencson et al. 2023). Based on comparison with a shock cooling model, Hosseinzadeh et al. (2023) estimated a progenitor radius of 410 R⊙. The progenitor was obscured by a dusty wind with a mass loss rate of Ṁ = 10−6−10−4 M⊙ yr−1 estimated by the pre-explosion imaging and the variability analysis of the progenitor (Jencson et al. 2023; Kilpatrick et al. 2023; Soraisam et al. 2023; Neustadt et al. 2024). The estimated pre-explosion luminosity of SN 2023ixf is log(L/L⊙) ∼ 4.7 − 5.2, which corresponds to a zero-age main-sequence (ZAMS) mass of MZAMS ∼ 10 − 20 M⊙ (Jencson et al. 2023; Kilpatrick et al. 2023; Neustadt et al. 2024; Ransome et al. 2024; Van Dyk et al. 2024). The ZAMS mass of the progenitor estimated using time variability of the IR emission is 20 ± 4 M⊙, which if correct would make the progenitor of SN 2023ixf one of the most massive progenitors of a Type II SN detected to date (Soraisam et al. 2023). Based on light curve modeling with the pre-explosion pulsation of the progenitor taken into account, Hsu et al. (2025) suggest the initial progenitor mass to be M > 17 M⊙. On the other hand, Bersten et al. (2024) estimate a ZAMS mass of 12 M⊙ with an explosion energy of 1.2 × 1051 erg and a 56Ni mass of 0.05 M⊙ based on comparison of the observations with their light curve models.
The morphological light curve parameters measured by Bersten et al. (2024) using bolometric measurements show that SN 2023ixf had a steeper decline during the plateau phase than the average SN II, putting it into the sub-class Type IIL. Previous studies show that morphological light curve parameters and spectroscopic properties of Type IIP and Type IIL form a continuous population, with a more general term Type II frequently used to refer to SNe falling under the two sub-classes (Anderson et al. 2014; Valenti et al. 2016; de Jaeger et al. 2019). The morphological difference is explained either by SNe IIL having less massive H-rich envelopes after more vigorous mass loss (Moriya et al. 2016; Hiramatsu et al. 2021) or by them having larger amounts of circumstellar material (CSM) around their progenitors at the time of explosion (Morozova et al. 2017). While forming a continuous population, SNe IIL may originate from more massive progenitors than SNe IIP. Chugai (2021) finds that SNe IIL have higher 56Ni and confined circumstellar shell masses than SNe IIP, implying higher progenitor masses.
The early-time (“flash”) spectroscopy of SN 2023ixf revealed emission lines of H I, He I/ II, C IV, and N III/ IV/ V with narrow cores and broad, symmetric wings arising from the photo-ionization of dense, close-in CSM prior to shock breakout (Bostroem et al. 2023; Hiramatsu et al. 2023; Jacobson-Galán et al. 2023; Smith et al. 2023; Teja et al. 2023; Yamanaka et al. 2023; Zimmerman et al. 2024). The early light curves and spectra indicate that the CSM was dense, produced by a mass loss rate of Ṁ = 10−3−10−2 M⊙ yr−1, and concentrated near the stellar surface (RCSM ≲ 1014 cm, Bostroem et al. 2023; Martinez et al. 2024). The mass loss rate estimated from the early SN observation or the pre-explosion imaging, as previously mentioned, possibly hints at a complex mass loss history prior to the explosion. The hard X-ray emission implies a number density of nCSM = 4 × 108 cm−3 at r < 1015 cm, corresponding to an enhanced progenitor mass loss rate of 3 × 10⁻⁴ M⊙ yr−1 for an assumed wind velocity of vw = 50 km s−1, which is much lower than the previously mentioned estimates based on the early light curves and spectra (Grefenstette et al. 2023).
Core-collapse supernovae (CCSNe) produce dust in their cooling ejecta. The time between the progenitor formation and the dust production is a few million years. This is substantially shorter than the time frame for dust to be produced by asymptotic giant branch (AGB) stars. AGB stars are the main dust producers in the present Universe, but they cannot explain the amount of dust found in galaxies at z ∼ 6 − 8 (Md ∼ 106 − 8 M⊙). This indicates CCSNe may be responsible for a large fraction of the dust in the early Universe (Morgan & Edmunds 2003; Dwek et al. 2007; Michałowski et al. 2010; Gall et al. 2011; Leśniewska & Michałowski 2019). Large masses (0.01 − 1 M⊙) of newly formed dust have been found in nearby SN remnants, including Cas A, Crab Nebula, SN 1987A, and G54.1+0.3 (De Looze et al. 2017, 2019; Priestley et al. 2020; Matsuura et al. 2015; Temim et al. 2017; Rho et al. 2018b), while much smaller amounts of dust (10−6 − 10−3 M⊙) have been found in young CCSNe after only a few tens to hundreds of days after the explosion. Examples of the latter include SN 2004dj (Meikle et al. 2011; Szalai et al. 2011), SN 2010jl (Gall et al. 2014; Fransson et al. 2014), SN 2017eaw (Tinyanont et al. 2019), SN 2020oi (Rho et al. 2021), and SN 2021krf (Ravi et al. 2023).
The formation of coolant molecules, including carbon monoxide (CO), precedes dust formation. CO is the first molecule to form in cooling ejecta because it has the highest dissociation energy of any molecule. Newly formed CO, which radiates efficiently in the infrared, cools the ejecta sufficiently for the dust particles to start to form. Near-infrared (NIR) emission from freshly formed CO and dust particles has been observed and analyzed in various types of CCSNe (e.g., Type II SN 2017eaw, Rho et al. 2018a; Type II-pec SN 1987A, Spyromilio et al. 1988; Liu et al. 1992; Wooden et al. 1993; Type Ic SN 2020oi, Rho et al. 2021). Similarly, Kotak et al. (2009) obtained spectra of Type IIP SN 2004et at near- and mid-infrared wavelengths, analyzing the evolution of the SiO molecules and the dust particles. By acquiring more examples of CO and dust emission in CCSNe, one can begin to look for relationships between progenitor type and amounts of CO and dust formation.
In this paper, we present and describe 16 NIR spectra of SN 2023ixf obtained with instruments at four telescopes, between 9 and 307 d after the explosion. In Section 2, we summarize the observations and data reduction procedures for each instrument. In Section 3, we discuss intermediate-width (IW; ∼1000 km s−1) line profiles found in the early epochs that may indicate the interaction between the expanding ejecta and the surrounding CSM. We also discuss the CO first overtone emission and the rising dust continuum found in the nebular phase spectra and estimate the physical properties of the gas containing the newly formed CO molecules using an emission model assuming the CO is in a local thermodynamic equilibrium (LTE). We compare the CO and dust formation in SN 2023ixf with that of other CCSNe reported in the literature, with a focus on SN 1987A. The availability of the 16 NIR spectra and their related findings is critical to understanding JWST observations of SN 2023ixf, which obtained spectra at only three epochs (33, 252, and 373 d; DerKacy et al. 2025; Medler et al. 2025).
2. Observations
2.1. Near-infrared spectroscopy
We used four different instruments to obtain 16 NIR spectra of SN 2023ixf. Our set of NIR spectra covers from 9 to 307 d after the SN explosion. In the following paragraphs, we describe the observation and data reduction procedures for each instrument.
Gemini GNIRS observations: We obtained NIR spectroscopy of SN 2023ixf in five epochs spanning 17 − 277 d after the explosion with the Gemini Near-Infrared Spectrograph (GNIRS) on the 8.1 m Frederick C. Gillett Gemini North telescope for programs GN-2023A-DD-105, GN-2023A-Q-218, GN-2023B-Q-225, and GN-2024A-DD-101, where GN-2023A-Q-218 and GN-2023B-Q-225 were from Gemini Korean time. We compared these data with spectra of SN2017eaw obtained for GN-2017A-DD8 and GN-2017B-DD5, which were previously reported by Rho et al. (2018a) but are newly analyzed in this work. For all of these observations of both SNe, GNIRS was configured in its cross-dispersed mode, 32 line mm−1 grating and a 0.45 arcsec-wide slit (oriented at the mean parallactic angle during each observation), which provided a resolving power of R ∼ 1200 covering 0.84 − 2.52 μm. We utilized the GNIRS cross-dispersed reduction pipeline package XDGNIRS (Mason et al. 2015) for reducing the spectra. Rho et al. (2021) and Ravi et al. (2023) describe the data reduction steps in detail.
Keck NIRES observations: We obtained six NIR spectra of SN 2023ixf with the Near-Infrared Echellette Spectrometer (NIRES) on the Keck II telescope as part of the ongoing Keck Infrared Transient Survey (KITS; Tinyanont et al. 2024). NIRES, a member of the TripleSpec family (Wilson et al. 2004), provides an R ∼ 2700 spectrum with its fixed 0 55 slit over the wavelength range 0.9 − 2.45 μm. The data were reduced using the pypeit general spectral reduction pipeline (Prochaska et al. 2020a,b). Further details of KITS observation and data reduction strategy can be found in Tinyanont et al. (2024).
IRTF spectra: We observed SN 2023ixf three times with the short cross-dispersion (SXD) mode of the SpeX spectrograph (Rayner et al. 2003) on the NASA InfraRed Telescope Facility (IRTF). Our use of the 0 8-wide slit resulted in a resolving power of R ∼ 750. The SN was observed in an ABBA dithering pattern, as was an A0V star close in air mass. The associated flat-field and comparison arc-lamp observations were taken immediately after the astronomical observations. The data were reduced using Spextool (Cushing et al. 2004); the reduction steps are described by Rho et al. (2021).
MMIRS spectra: We obtained two sets of zJ and HK (taken using the high-throughput HK3 filter) spectra at 199 and 257 d post-explosion using the MMT and Magellan Infrared Spectrograph (MMIRS; McLeod et al. 2012) on the 6.5 m MMT located on Mt. Hopkins in Arizona. We also obtained one K3000 (1.90 − 2.45 μm) spectrum at 257 d. All MMIRS spectra were taken using a 1.0″-wide longslit. For data reduction, we used the MMIRS pipeline (Chilingarian et al. 2015). Telluric and absolute flux corrections were done according to the method described in Vacca et al. (2003) with XTELLCOR (a part of Spextool package; Cushing et al. 2004) using a standard A0V star observed at similar air mass and time.
We present the set of spectra in Figure 1. The information for the NIR observations of SN 2023ixf is summarized in Table 1. We adopted a redshift of z = 0.000804 for SN 2023ixf from Hosseinzadeh et al. (2023) for M101and an extinction value of E(B − V)host = 0.031 ± 0.006 mag (Hosseinzadeh et al. 2023; Smith et al. 2023), which has a negligible effect on the NIR spectra.
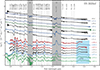 |
Fig. 1. Gemini/GNIRS (17, 37, 67, 249, and 277 d; blue), Keck/NIRES (9, 19, 47, 71, 259, and 275 d; black), IRTF/SpeX (39, 278, and 307 d; green), and MMT/MMIRS (199 and 257 d; red) spectra of SN 2023ixf in time order (top to bottom). Each spectrum is labeled with the days elapsed after the explosion. The wavelengths of known strong lines (e.g., Meikle et al. 1989) are marked with dotted lines. Regions with significant noise due to strong telluric absorption are shaded in gray. The wavelength region of the first overtone CO emission is shaded in light blue. We also include Paschen α (1.875 μm), which falls in a region of poor telluric transmission, marked by a black dotted line. The Brackett δ and ϵ lines, which also fall in the region, are artifacts due to incomplete removal of the same lines in the standard stars, despite appearing to be present in some of the spectra. |
Summary of IR observations.
2.2. Optical spectroscopy
Las Cumbres Observatory (LCO) optical spectra from 6 to 440 d after the explosion were taken with the FLOYDS spectrographs mounted on the 2m Faulkes Telescope North (FTN) at Haleakala (USA) through the Global Supernova Project. The first three spectra from 6, 7, and 9 d were previously published in Bostroem et al. (2023). All spectra were obtained through a 2″-wide slit oriented at the parallactic angle in order to minimize light loss (Filippenko 1982). One-dimensional spectra were extracted, reduced, and calibrated following standard procedures using the FLOYDS pipeline1 (Valenti et al. 2014). The oscillations in the FLOYDS spectra that appear above 7500 Å, are due to fringing. We focus on hydrogen recombination lines that show absorption features as shown in Figure 3. The entire set of optical spectra and their analysis will be presented in another paper (Brian Hsu, in prep.).
Observed line properties of narrow features and associated broad lines.
3. Results and discussion
3.1. Near-infrared spectra of SN 2023ixf
Figure 1 shows 16 spectra ranging 0.8–2.5 μm of SN 2023ixf between days 9 and 307 since the explosion These data form one of the most extensive sets of near-infrared spectra of a SN II obtained to date. The only other comparable NIR coverage of a SN II is that of SN 2017eaw (Rho et al. 2018a). The near-infrared spectra set from SN 2023ixf covers 9 – 71 d and 199 – 307 d, while that of SN 2017eaw covers t < 205 d. We have made the 16 SN 2023ixf NIR spectra available to the astronomy community via VizieR.
The first eight spectra, obtained during the photospheric phase, are dominated by hydrogen recombination line emission, a [S II] absorption at 1.046 μm, and He absorption features (weaker than those of SN 2017eaw) all superimposed on a continuum that decreases monotonically with increasing wavelength. In the spectra between 199 and 307 d, some of the line emission is from gas that is nebular in density. The atomic lines become much more prominent in the nebular phase. In addition, CO overtone band emission at 2.3–2.5 μm is present in these latter spectra, together with a flattening of the continuum at λ > 1.5 μm, not seen in the earlier spectra, which we interpret as emission from newly formed hot dust.
3.2. Line profiles and CSM properties
The earliest few optical spectra of SN 2023ixf exhibited narrow (FWHM ≲ 200 km s−1) hydrogen emission lines and narrow flash-ionized lines (e.g., He II, C IV, N IV) that disappeared within one week after the explosion (Smith et al. 2023; Bostroem et al. 2023; Jacobson-Galán et al. 2023). IW (200 km s−1 ≲ FWHM ≲ 1000 km s−1) P Cygni H α profiles were observed in the days following the disappearance of narrow lines before they themselves disappeared by 18 d (Smith et al. 2023). The narrow lines in the early spectra are often attributed to dense CSM concentrated near the progenitor star, and the disappearance of the narrow lines is attributed to the ejecta engulfing the dense CSM (Terreran et al. 2022; Andrews et al. 2024; Dastidar et al. 2024). The IW lines imply ejection velocities much faster than typical RSG wind velocities. Smith et al. (2023) suggest that the IW features found in the optical are emitted from the cool dense shell (CDS) formed at the ejecta-wind interface, similar to what has been observed in Type IIn SNe and Type IIP SNe interacting with CSM (Chugai et al. 2004; Andrews et al. 2010; Smith et al. 2010; Andrews et al. 2011, 2017). However, the same features may instead originate, as Bostroem et al. (2023) suggested, from unshocked and radiatively accelerated CSM in front of the shock if the surrounding CSM is dense and sufficiently confined (Chugai et al. 2002; Tsuna et al. 2023).
Our set of NIR spectra, presented in Figure 1, includes only two epochs (9 and 17 d) before 18 d when the optical spectrum was almost featureless. The optical spectra near 17 d show weak broad absorptions without noticeable broad emissions, but the NIR spectra show broad features, many of which contain both absorption and emission, starting at 9 d. We also find sporadic narrow features well into the photospheric phase (t ≳ 30 d), which may indicate episodic interactions between wind clumps and CSM.
A list of narrow line features and the associated velocities is presented in Table 2. The table includes the widths of the narrow features, the velocity shifts measured at the peak of the emission and the absorption features for both narrow and broad features, if present. Figure 2 contains velocity profiles of these narrow features, with the y-axis being the flux normalized to the continuum. Narrow He I features were present from 9 d to 71 d. The differences in FWHMs between the narrow features in the earlier epochs (∼20 d) and in the later epochs (39 − 71 d) may indicate different origins of the features in these two time periods. In the paragraphs following, we distinguish IW features from narrow features according to their FWHMs. The FWHMs of the IW features estimated from the earlier epochs (500 − 1000 km s−1) are consistent with the “intermediate-width” features in the optical spectra at those times, whereas the FWHMs of the narrow features from the later epochs are smaller and are closer to those of narrow flash-ionized lines (Smith et al. 2023; Bostroem et al. 2023). It should be noted that the broad features in the region (1.06 − 1.10 μm) are a blend of the He I 1.083 μm and Pa γ 1.094 μm lines with the relative contributions of the two changing with time, so interpreting the temporal evolution of Vshift or ΔV as the temporal evolution of the ejecta velocity is risky.
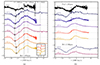 |
Fig. 2. (a) Velocity profiles of He I 1.083 μm from 9 to 71 d. Lines identified from IW features (FWHM ∼ 1000 km s−1) are marked with black dotted vertical lines. The inset at the bottom right corner shows narrow (FWHM ∼ 100 km s−1) features at 47, 67, and 71 d, near the zero velocity of He I 1.083 μm. Black boxes connected via black dashed lines indicate the velocity of absorption troughs of broad P Cygni profiles. (b) Velocity profiles of Pa β 1.282 μm and Br γ 2.166 μm from selected epochs. The Pa β line shows an IW feature at 9 d, and the Br γ line shows IW features at 17 and 39 d. See Table 2 for the FWHMs and the shifts from zero velocity of the IW and narrow lines under the columns labeled “Narrow line.” Table 2 also show the velocity shifts of broad absorption, and the velocity interval between minimum and maximum of P Cygni profile. |
We modeled the line profiles using multiple Gaussian or Lorentzian components in order to estimate the velocity shifts and the FWHM velocities presented in Table 2. We used Gaussian profiles for broad (FWHM ∼ 5000 km s−1) components, Lorentzian or Gaussian profiles for IW components. Our choice between Lorentzian and Gaussian profiles depends on the shape of the lines. Figure 4 contains examples of multi-component fitting. In the right panel of Figure 4, the Pa β feature at t = 9 d is fitted with three components: (1) a broad absorption with a Gaussian profile centered at a velocity shift of ∼ − 5170 km s−1, (2) a broad Gaussian emission, and (3) an IW Lorentzian emission component centered at ∼ − 80 km s−1, with a FWHM of 720 km s−1. The fitting was performed sequentially, starting with the broad absorption component, followed by the broad emission component, and finally the IW component. In the case of an IW component from another line (e.g., Pa γ and C I) overlapping the major line feature, we performed the IW line fitting as the final step. This is shown in the left panel of Figure 4 where we fit the He I velocity plot with an overlapping Pa γ IW emission shown at t = 9 d with five Gaussian profile components: 1) broad absorption, 2) IW absorption, 3) broad emission, 4) IW emission, 5) IW Pa γ emission.
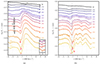 |
Fig. 3. Line profiles of H α(a) and H β(b) of SN 2023ixf. Of particular interest are a “dip” (“B” marked in red) on the blue side of the profile with velocities of ∼−6000 km s−1 at 57, 67, and 71 d, and a weak absorption feature (“A” marked in black with boxes) at high velocity (−12 000 km s−1) between 27 and 57 d (see Leonard et al. 2002, also the HV in SN 1999em). These features (indicated by arrows and labeled “A” and “B”) are called “Cahitos” (see Gutiérrez et al. 2017). These feature are caused by interactions, geometry, and viewing angles between the reverse shock, the CSM and ejecta (Chugai et al. 2004). The epochs are labeled on the right. The inset at the bottom right corner shows “A” cachito features at 36, 39, 40, and 47 d. The absorption-like features at 14 000 km s−1 in H α are due to telluric absorption. |
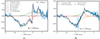 |
Fig. 4. Multi-component line fitting of He I 1.083 μm (a) and Pa β 1.282 μm (b) at 9 d with with Gaussian and Lorentzian components. The He I 1.083 μm line profile (a) was fitted with two broad Gaussian profiles with FWHMs of 5250 and 6010 km s−1 for absorption and emission, along with two intermediate-width (IW) Gaussian profiles with FWHMs of 1000 and 670 km s−1 for absorption and emission. The Pa γ 1.094 μm that overlaps the He I 1.083 μm was simultaneously fitted with an intermediate-width Gaussian profile with FWHM of 980 km s−1. The Pa β 1.282 μm line profile (b) was fitted with two broad Gaussian profiles with FWHMs of 4790 and 5150 km s−1 for absorption and emission, respectively, and an intermediate-width Lorentzian emission profile with FWHM of 720 km s−1 (red). |
P Cygni line profiles such as in H α lines indicate that the emitting region is very close to the photosphere, which causes a significant flux-deficit in the red, made greater by the rapidly declining density distribution (Dessart & Hillier 2005). This provides a clear explanation for the noticeable blue-shift of emission peaks of P Cygni profiles observed in early-time spectra of SNe II. Line transfer effects in the ejecta above the photosphere produce P Cygni profiles whose shape and intensity depend upon the velocity and optical depth structures of the ejecta. Analyses of the line profiles by combining multiple Gaussian and Lorentzian components instead of properly modeling synthetic spectra are, at best, phenomenological and should be viewed with caution. CSM interaction is another factor that further complicates analyses of P Cygni profiles. A cool dense shell formed by the reverse shock when the forward shock reaches the CSM may have produced the IW line emission and even IW absorption if a thick enough CSM existed near the progenitor surface before the explosion. The double P Cygni structure of He I 1.083 μm at 9 d shown in the right panel of Figure 4 may imply a complex ejecta structure during the early (∼10 d) phase of SN 2023ixf.
At 47 and 71 d, weak and narrow P Cygni profiles were present in the He I 1.083 μm line near V ∼ 0. Their FWHMs (∼100 km s−1) are lower than those of IW features from the earlier epochs but still imply ejection velocities faster than the typical velocity of a RSG wind. They may be due to the radiative acceleration of unshocked CSM or a faster wind ejected from the progenitor star sometime before the explosion (Smith et al. 2023). Assuming an SN ejecta velocity of ∼10 000 km s−1, and a pre-explosion wind velocity of 100 km s−1, it can be inferred that the wind interacting with the ejecta during this epoch was ejected from the progenitor roughly 20 years prior to the explosion. For a 15 M⊙ progenitor, this corresponds to the carbon shell burning stage (Fuller 2017).
We also find IW features in lines other than He I. At 9 d, the IW Pa γ line overlaps the red wing of the broad He I emission. At 39 d, an IW emission peak centered at 1.068 μm rises from the broad absorption trough of He I. This line is near the C I multiplet at 1.0695 μm, previously found in SN 1987A at day 18 by Meikle et al. (1989) based on the prediction of Branch (1987). The emission feature has disappeared by day 112 in SN 1987A when He I 1.083 μm line dominates at its wavelength. The C I line would be expected to reach maximum strength at a temperature of ∼4500 K and weaken as the ejecta cools (Meikle et al. 1989). The appearance of the C I line at 39 d for SN 2023ixf is later than that of SN 1987A, but the blackbody temperature of ∼5000 K found for SN 2023ixf by Singh et al. (2024) at ∼39 d allows for the possible formation of this line. We find a weak emission bump and a broad excess at approximately the same wavelength at 19 d that may be related to this IW emission feature. Other IW features are present in the 9 to 17 d spectra. In Figure 2b, the Pa β 1.282 μm line at 9 d contains an IW feature on top of a broad P Cygni profile, which disappears by 17 d. Although a broad P Cygni profile strengthens at later epochs, no narrow or IW features associated with CSM interaction are present. Narrow features at v ∼ −4000 km s−1 (λ = 1.267 μm) relative to Pa β are artifacts of the reduction process due to strong telluric O2 emission. At 17 d, an IW O I 1.129 μm line not associated with a broader feature and a Br γ profile with a weak, IW component on top of a broad P Cygni profile are present. The same complex Br γ profile is still present at 39 d. The FWHM velocity and the blue-shift of IW Br γ feature are comparable to those of the IW C I 1.0695 μm line observed on the same day.
The IW features found before 20 d in NIR are similar to those found in the optical, except that the He I profiles also include IW absorption. The time of the disappearance of these NIR features is later than in the optical, with the Br γ and a possible C I feature with FWHM ∼400 − 600 km s−1 being present in the 39 d spectrum, whereas the IW optical features disappear by 18 d (Smith et al. 2023). We also find narrow absorption features of He I whose FWHM is 100 − 200 km s−1 with two of them accompanied by narrow emission features, together resembling P Cygni profiles.
3.3. Optical high-velocity absorption features
Summary of optical spectroscopy of SN 2023ixf using LCO. labelTopti
The H α and H β line profiles in SN 2023ixf are shown in Figure 3. High-velocity (HV) absorption features are present in many of the LCO optical spectra. The features (marked “A” and “B” in Figure 3) were present on the blue sides of the P Cygni profile. Similar HV features have been reported in SN 2009N and a few other SNe, including SN 1992ba (Takáts et al. 2014; Gutiérrez et al. 2017; Davis et al. 2019). These HV features are known as “Cachitos.” They arise from the interaction of high-velocity ejecta with an RSG wind, which results in the enhanced excitation of the outer layers of unshocked ejecta and the emergence of corresponding HV absorption (Chugai et al. 2007). The HV components of H α and H β include shallow absorption lines (marked as “A” in Figure 3) at earlier times (21 − 47 d), and the cachitos appear close to H α (marked as “B”) at later times (51 − 71 d). They are similar to those seen in SN 2007X (see Figure 13 of Gutiérrez et al. 2017). Teja et al. (2023) and Singh et al. (2024), using a different set of data, report high-velocity absorption features in SN 2023ixf from 16 d to 70 d after the explosion. Singh et al. (2024) interpret the cachitos as originating from ejecta at different velocities, due to the aspherical distribution of CSM rather than from excitation of unshocked outer ejecta (Davis et al. 2019).
3.4. Fitting CO features of SN 2023ixf
CO first overtone band emission was detected at eight consecutive epochs from 199 d to 307 d (our final observation) as shown in Figure 1. The last non-detection of CO was 71 d. Based on NIR observation of SN 2017eaw (Rho et al. 2018a) and dust models by Sarangi & Cherchneff (2013), newly formed CO molecules in SNe II are predicted to be detectable after ∼100 d. However, SN 2023ixf was largely not observable between that day and 199 d because of its proximity to the Sun. The first detection of CO emission at 199 d is an upper limit date for the epoch of detection, whereas 71 d is a lower limit. SN 2017eaw shows a weak CO detection at 107 d with clear detections at 124, 140, 169, and 205 d (Rho et al. 2018a). The timing of CO appearance (> 100 d) is consistent with the chemically controlled dust formation model proposed by Sarangi & Cherchneff (2013). From the above upper and lower limits, SN 2023ixf may also have developed CO emission ∼100 days since the explosion.
The 2.0–2.5 μm portions of the spectra taken between 249 and 307 d are shown in Figure 5. We have modeled the CO emission in them using an LTE model based on Goorvitch (1994) and Cami et al. (2010). We assume pure 12C16O in our modeling, as previous studies have shown that the CO emission from SNe can be adequately explained by pure 12CO (Banerjee et al. 2018; Rho et al. 2018a, 2024).
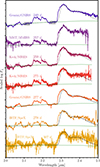 |
Fig. 5. Observed line first-overtone bands in SN 2023ixf from 249 to 307 d are superposed with the best LTE model fits (black dashed). A linear continuum was adopted for each spectrum. More details are provided in the text. The best-fit parameter values are presented in Table 1. |
Our CO model uses the line parameters in Goorvitch (1994), which are consistent with those in the HITRAN database2 (Rothman et al. 2005). In Cami et al. (2010), where the molecules are assumed to be isothermal and in LTE, the line strength Sν0 of a line with a transition frequency of ν0 is determined as a function of the CO temperature T. Our model computes the line strength Sν0 following Equation (5) of Goorvitch (1994) and Equation (1) of Cami et al. (2010):
 (1)
(1)
where gf is the value of the statistical weight g multiplied by the emission oscillator strength f, P(T) is the partition function, and E1 is the energy of the lower level. We adopt Einstein-A values, the gf value, and P(T) from (Table 14 of Goorvitch 1994) which lists these values for all the ro-vibration transitions of the first overtone band up to υ = 20 and J = 149. Each transition experiences broadening following the line profile function ϕ(ν), a Gaussian with the CO velocity VCO as the FWHM. We validated that the CO line strengths we calculated match the emission strengths S (column 6) listed in the tables of Goorvitch (1994) for a temperature of 3000 K. The flux of CO emission is calculated as
 (2)
(2)
where VCO is the velocity of CO, t is the time since the explosion, d is the distance, NCO is the column density of CO, ϕ(ν) is the line profile function, and Bν(T) is the flux of a blackbody spectrum following the CO temperature T at frequency ν. In the fitting process, we use kmpfit, part of the Kapteyn package (Terlouw & Vogelaar 2014). The program has been applied to the fundamental CO band of the SN remnant, Cas A, to reproduce the JWST spectra (Rho et al. 2024) using the mid-infrared CO table (Table 13 from Goorvitch 1994).
The total mass of CO, MCO, is related to the velocity and the column density of CO through the following equation:
 (3)
(3)
where m is the mass of a 12C16O molecule. We assumed the CO line emission to be optically thin. This approach is similar to what we used in Banerjee et al. (2016) and Rho et al. (2018a).
We compare our LTE model with that of Rho et al. (2018a) by applying our model fitting to the spectra of SN 2017eaw. We find that the CO properties depend on the choice of continuum level. Rho et al. (2018a) briefly discussed the idea of different choices of the continuum, but the effects of the different choices were not fully explored. We experimented with 8–10 choices of continuum flux levels for each date and obtained best-fit CO parameters for each (see Figure A.1). We present the median values of CO parameters in the lowermost section of Table 1 with the error values stating the systematic error. For example, the spectrum at 169 d yields CO temperatures of TCO = ( ∼ 2750 K, ∼3050 K, 2915 K), CO velocities of VCO = ( ∼ 2570, ∼2890, 2750
 ) km s−1, and CO masses of MCO = ( ∼ 2.0 × 10⁻⁴, ∼1.9 × 10⁻⁴, 1.95
 ) M⊙, for the highest possible continuum flux, the lowest continuum flux, and median values of each 8–10 measurements, respectively. Overall, our LTE model’s estimated CO properties are consistent with those of Rho et al. (2018a).
The CO temperatures are determined by the relative strengths of the band heads, resulting in different CO temperatures for different continua. For any given width of CO band heads, a lower CO velocity comes with a lower CO temperature. We also find that the CO mass increases with increasing continuum level, which might be counterintuitive since the CO emission is actually weaker. However, for given strengths of CO emission, a higher CO temperature requires less CO to match the observed band strength. We estimated the uncertainties in CO temperature, velocity, and mass for each choice of continuum. The estimated CO properties of SN 2017eaw using our LTE model are consistent with those of Rho et al. (2018a).
Following the above exercise, we fit the CO model to each spectrum of SN 2023ixf using the wavelength ranges 2.10 − 2.13 μm and 2.24 − 2.27 μm with the dust emission model to define the flattened continua. We discuss the dust emission model in Section 3.6. The CO emission in each spectrum was fitted over the wavelength range of 2.27 − 2.46 μm, which approximately covers υ = 2 − 0 to 6 − 4 band heads. The estimated CO and dust parameters are shown in Table 1. We also experimented using linear continua (“Model A” in Table 1) pinned to the spectrum at 2.10 − 2.11 μm and 2.23 − 2.25 μm and using a modified black body continuum with carbon dust (“Model B”); the results were more or less the same for the two models. In Figure 5, we show the observed and best-fit model spectra for seven of the eight epochs when CO was detected. We could not find reliable CO parameters for the 199 d spectrum from the model fitting because the observation did not cover enough of the CO emission. The CO temperature is constrained by the relative strengths of the different CO bands and requires data at wavelengths longer than 2.36 μm, which was the long wavelength limit for the spectrum at 199 d.
The results of the CO model fitting between 199 d and 307 d are listed in Table 1. Based on the model fits, the CO mass, temperature, and velocity were roughly constant from 249 to 278 d: TCO ∼ 1800 − 2300 K, VCO ∼ 3000 − 3500 km s−1 within the errors. We note that in addition to the standard statistical errors provided in the CO temperature column, the 10–20% uncertainty in the flux value and the telluric correction may result in uncertainties of 100–200 K in the CO temperature and a factor of ∼2 in the CO mass estimates from the fitting process.
We find that the estimated CO mass decreases with time. The model by Liu et al. (1992) predicts such a decrease because although the formation rate scales as t−3, the CO destruction rate scales as e−t/111.3 d, the decay rate of 56Co. At later times, cooling of the ejecta also decreases the CO formation rate. In contrast, Sarangi & Cherchneff (2013) predict that total CO mass increases over time, but the CO mass of each individual nucleosynthetic zone could increase or decrease as a function of time.
In Table 1, we list values of our best-fit CO parameters for spectra acquired using MMT with parentheses to indicate their high uncertainties. The MMT spectrum at 257 d extends to 2.45 μm using the K3000 filter. We find the shape of the MMT spectrum in the K3000 filter range (1.90–2.45 μm) differs from those of Gemini and Keck spectra at approximately the same date. Since the K3000 filter is not well used and tested, the systematic errors, including detector transmission and calibration errors, are likely larger than they are for spectra taken at other observatories.
At the bottom of Table 1, we include the CO parameters estimated from five nebular phase spectra of SN 2017eaw taken with GNIRS. Spectra taken at 124 − 205 d were previously presented in Rho et al. (2018a), but we re-fit them using the procedure described above (see Figure A.1).
NEOWISE-R detected SN 2023ixf at 4 − 11 d, 211 − 219 d, and 370 − 372 d (Van Dyk et al. 2024). At the later dates, a NEOWISE-R excess with a dust temperature of 700 K was reported, which could arise either from newly formed dust or pre-existing dust. The CO detection indicates that CO cooling occurs in the gas, which can lead to dust formation in the ejecta. Therefore, we suggest that the observed excess continuum (from the black-body function) is from newly formed dust. Unfortunately, the dates do not overlap with our NIR spectra and do not allow us to estimate dust masses by combining our data with the NEOWISE-R coverage.
3.5. CO emission of SN 2023ixf and other type II SNe
All of our best-fit models underestimate the CO fluxes in the wavelength intervals 2.28 − 2.31 μm and 2.41 − 2.50 μm. Similar discrepancies between LTE models and the observed strength of the CO emission at 2.28 − 2.31 μm are also found in SN 2017eaw (see Figure 2 of Rho et al. 2018a) and Type II-pec SN 1987A (see Figure 1a of Spyromilio et al. 1988), but not in Type IIb/Ib SN 2016adj (Banerjee et al. 2018) and Type Ic SN 2020oi (Rho et al. 2021). The shorter wavelength interval corresponds to the CO emission near the first (2 − 0) band head, which could be strengthened by considering non-thermal excitation effects (Liu et al. 1992; Rho et al. 2021). Including CO+, whose (2 − 0) band head is at 2.26 μm, also increases the flux of the 2 − 0 band head as can be seen in the Spyromilio et al. (1988) spectra of SN 1987A, but we did not find CO+ emission at 2.26 μm in our spectra, nor was it present in SN 2017eaw (Rho et al. 2018a).
The CO emission models exhibit flux declines steeper than the observed spectra at wavelengths λ > 2.41 μm. The spectrum at 249 d fits better than the others. The same type of discrepancy is also present in LTE models for SN 1987A at day 349 (see Figure 1 of Liu et al. 1992) and may be present earlier than 349 d (255 or 283 d) when the spectra did not cover wavelengths at λ > 2.4 μm. This discrepancy is not found in the CO LTE models of Rho et al. (2018a) or Banerjee et al. (2016), and the difference may be due to them having higher temperatures (∼3000 K) than those of SN 2023ixf or SN 1987A (∼2000 K). An alternative explanation could be due to an additional component of dust emission cooler than the component modeled for this fitting. Liu et al. (1992) also considered a non-LTE case where the models are closer fits to the observations in the longer wavelength range and yield CO masses about one order of magnitude larger than those of LTE models (see also Cherchneff & Dwek 2009).
We compare the CO features in SN 2023ixf with those of SN 2017eaw and SN 2020oi in Figure 6. The 205 d spectrum of SN 2017eaw shows clearly distinguished peaks at 2.29 μm and 2.32 μm, corresponding to the υ = 2 − 0 and 3 − 1 band heads, respectively. The band heads at longer wavelengths are weaker but still identifiable. In contrast, the CO emission profiles of SN 2023ixf and SN 2020oi are smoother than that of SN 2017eaw. The 199 d spectrum of SN 2023ixf and 63d spectrum of SN 2020oi do not show noticeable peaks at all, while the 249 d spectrum of SN 2023ixf CO emission rising at 2.28 μm to a peak at 2.32 μm and connecting to flat emission starting at about 2.35 μm. The 2.32 μm emission bump is broader than the peaks seen from SN 2017eaw. In the models, smoother CO emission profiles result from a combination of higher CO velocities and lower CO temperatures. For the best-fit parameters of the 249 d CO emission of SN 2023ixf, we find a similar CO velocity but a lower CO temperature than those for the 205 d CO emission of SN 2017eaw. For the 63 d spectrum of SN 2020oi, the CO velocity estimated by Rho et al. (2021) is slightly higher (v ∼ 3700 ± 100 km s−1) than the CO velocities of SN 2023ixf in this work. The 199 d CO spectrum differs from the 249 d spectrum of SN 2023ixf in that the flux stays flat at λ = 2.3 − 2.35 μm, close to the 63 d spectrum of SN 2020oi. This could be hinting at a higher CO temperature and velocity, but the wavelength coverage is too limited to allow detailed comparison with the models.
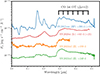 |
Fig. 6. Spectra of SN 2023ixf at 199 d and 249 d compared with those of Type IIP SN 2017eaw at 205 d and Type Ic SN 2020oi at 63 d. All spectra are shifted back to z = 0, and the spectra of SN 2017eaw and SN 2020oi are multiplied with constants for visual comparison. Rest wavelengths of the CO first overtone emission band heads for 2–0, 3–1, 4–2, 5–3, 6–4, 7–5, and 8–6 transitions are 2.294, 2.323, 2.353, 2.383, 2.414, 2.446, and 2.479 μm, respectively (marked as thick black lines). |
The existence of peaks at each CO band head is critical for constraining CO velocity in model fits; their absence complicates the velocity analysis. In such cases, the emission can be fitted using a LTE model with a larger velocity width. The models show slight bumps at 2.364 μm and 2.389 μm while the observed spectra do not (e.g., at 277 d). This may imply higher velocities than our estimates.
Comparing the CO emission of SN 2023ixf with that of other SNe II, we find that the CO temperature for SN 2017eaw at 205 d (TCO ∼ 2400 K) is similar to that of SN 2023ixf at 199 d (TCO ∼ 2500 K), although the latter could not be well-constrained due to the reduced wavelength coverage of the MMT data. Although we find lower CO temperatures at later times, it is possible that CO emission originate from gas at more than two temperatures, as seen in the young SN remnant, Cassiopeia A (Cas A) (Rho et al. 2024).
We also compare the spectra and CO properties of SN 2023ixf with those of SN 1987A, as shown in Figure 7. The first overtone CO features were detected at phases 250 − 280 d in SN 2023ixf and in SN 1987A (Spyromilio et al. 1988; Liu et al. 1992). SN 2023ixf shows a sharp cut-on caused by the υ = 2 − 0 band head (rest wavelength λ = 2.2935 μm), a broad peak at 2.312 μm due to υ = 2 − 0 and 3 − 1 R branch emission lines, and weaker broad emission staring at ∼2.36 μm and extending at least to 2.45 μm due to a combination of R and P branch lines from a range of vibrational upper levels. In contrast, SN 1987A shows emission near the 2 − 0 and 3 − 1 band heads peaking at 2.30 and 2.33 μm. The temperature of SN 2023ixf is ∼2000 (1600 − 2500), while Spyromilio et al. (1988) estimated the CO temperature of SN 1987A at 250 − 280 d after the explosion to be 1600 − 1800 K (Spyromilio et al. 1988) and 1700 − 2000 K (Liu et al. 1992) assuming LTE in the ejecta. Liu et al. (1992) also estimated a CO temperature of 2500 − 2800 K using non-LTE assumption.
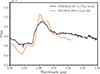 |
Fig. 7. Spectrum of SN 2023ixf at 277 d compared with that of Type II-pec SN 1987A at 283 d. SN 2023ixf shows a sharp rise at 2.29 μm due to the CO R branch’s υ = 2 − 0 R branch and additional emission extending at least to 2.45 μm, due to lines of both the CO R and P branches. In contrast, SN 1987A shows structures near 2.30 μm and 2.33 μm due to the CO 2 − 0 and 3 − 1 band heads with extended emission at longer wavelength due to lines from both the CO R and P branches. |
Our estimates for the CO temperatures (T = 1600 − 2500 K) of SN 2023ixf at 250–280 d are comparable to the LTE estimates for SN 1987A during the same period. However, unlike the spectra of SN 1987A which showed two distinct band head peaks at 2.30 and 2.33 μm, the spectra of SN 2023ixf show a sole peak at λ ∼ 2.31 μm due to a larger ejecta velocity. The CO velocity of SN 2023ixf is 3000–3800 km s−1 while that of SN 1987A is ∼1800 km s−1. The LTE models for a CO velocity of 3000 km s−1 with various CO temperatures are shown in Figure A.2. At low temperatures (TCO < 2300 K), the first two band head peaks merge together and appear to be one wide peak.
In addition to the CO velocities of SN 2023ixf being higher than those of another SN II, we find that the hydrogen lines of SN 2023ixf are much broader than those of SN 2017eaw. The FWHM of Pa β of SN 2023ixf at 199 d is ∼5800 km s−1, almost three timers larger than that of SN 2017eaw at 205 d (FWHM ∼ 2100 km s−1). We suggest that the slanted, boxy profiles observed in the optical spectra of SN 2023ixf originate from the interaction between the ejecta and the asymmetric CSM (Kumar et al. 2025; Bostroem et al. 2023). A massive progenitor mass for SN 2023ixf (MZAMS ≳ 17 M⊙; Hsu et al. 2025) is comparable to that of the luminous, short-plateau SN 2023ufx (MZAMS ∼ 19 − 25 M⊙) found by Ravi et al. (2025) with a notable similarity of shape in boxy Pa β profiles, but the lines are much broader in SN 2023ufx than in SN 2023ixf.
The light curve of SN 1987A differs from that of a typical SN II, with its luminosity rising until it reaches the peak at ∼100 d. The progenitor of SN 1987A was a blue supergiant (Arnett et al. 1989; Dessart & Hillier 2019). On the other hand, the light curve of SN 2023ixf exhibits a steeper decline than an average SN II during the plateau phase (∼80 d), and its progenitor was a RSG (Hosseinzadeh et al. 2023; Bersten et al. 2024). We find different CO parameters for SN 2023ixf and SN 1987A around the same phase, which might imply the dependency of the onset of CO and dust formation on their progenitors, explosion energies, 56Ni masses, or SN asymmetries. Observations of additional SNe II are required to discriminate between these possible explanations.
3.6. Dust emission from SN 2023ixf
The continuum below 1.5 μm can be fit by a black-body function with a temperature of ∼5000 K, but the continuum shows excess above 1.5 μm. Therefore, we model the dust emission that flattens the spectra at λ > 1.5 μm, similar to the methods used in Rho et al. (2021). The dust continuum was fit with a Planck function [Bν(T)] multiplied by the absorption efficiency (Qabs), where we assume carbon dust since it condenses at higher temperatures (T = 1100 − 1700 K) than other types of dust (Fedkin et al. 2010). Details of the absorption efficiency are given in Rho et al. (2018a). The dust continuum models for each spectrum are shown in Figure 5 as green solid lines.
The dust temperature and mass for each fit from 199 to 307 d are listed in Table 1. We find dust temperatures of ∼900 − 1060 K and dust masses of ∼(0.7 − 2.3)×10−5 M⊙ from 199 to 307 d. In the NIR (< 2.5 μm) range, we find no clear trends with time in the dust temperature, considering a large systematic error due to the choice of continuum (see Table 1). On the other hand, though the systematic uncertainties are large, the dust masses estimated from the NIR emission show an apparent decrease over time. However, the dust observed in the NIR must be warm to be observable, and additional cooler dust, which is undetectable in the NIR and whose mass is expected to increase with time, could be present (Gall et al. 2014; Wesson & Bevan 2021). Physico-chemical dust models by Sarangi & Cherchneff (2013, 2015) and Sluder et al. (2018) for SNe IIP show several dust components developing in the ejecta a few hundred days after the explosion. If the colder dust exists, the warm dust (∼1000 K dust in Table 1) inferred from the NIR may not accurately estimate the total dust mass. In this case, the dust mass can be much greater (examples can be seen in Sakon et al. 2009; Szalai et al. 2011; Rho et al. 2018b; Priestley et al. 2022). The warm component is interpreted to be from dust in diffuse ejecta gas (Priestley et al. 2019).
Indeed, our quick analysis of archival JWST data at day 252 covering both NIR and mid-IR ranges shows significant mid-IR flux excess that supports the existence of a cooler dust component during this period. The full JWST analysis is beyond the scope of this paper; a detailed presentation of the mid-IR dust component, along with the complete analysis of the JWST data, will be provided in future studies (Medler et al. 2025; Jacobson-Galán et al. 2025). Several scenarios to explain the flattened continuum in the NIR are discussed in Rho et al. (2021). Although a thermal echo from the CSM or heated pre-existing CSM dust cannot be completely ruled out, the simultaneous appearance of warm dust and CO supports the interpretation of dust formation in the ejecta, as CO is known to be a dominant coolant. IR spectra with broader and longer wavelength coverage, such as that provided by the JWST and future far-IR telescopes such as the Origins Space Telescope, would be needed to accurately estimate the dust temperatures and masses as a function of time.
4. Summary
We have presented a time series of 16 near-infrared spectra of SN 2023ixf from 9 to 307 d, taken with multiple instruments: Gemini/GNIRS, Keck/NIRES, IRTF/SpeX, and MMT/MMIRS. We quantitatively compared their spectra and found their calibration and spectra are consistent overall. MMIRS made the first CO detection of SN 2023ixf at 199 d, and Keck/NIRES provided the highest spectral resolution. Gemini/GNIRS covered the longest wavelengths, important for study of the CO first overtone band, and IRTF/SpeX performed well for bright targets such as SN 2023ixf. The spectra presented are valuable for combining and comparing with the JWST spectra and other ground-based spectroscopic data. The findings of this work is listed as follows:
1. In the earliest eight epochs (t = 9 − 71 d), narrow (FWHM ∼ 100 km s−1) and intermediate-width (FWHM ∼ 1000 km s−1) line emission and absorption features originating from the ejecta-wind interaction are present. We found intermediate-width features superimposed on broad P Cygni features during the first 40 days after the explosion. These could originate in the cool, dense shell formed by CSM swept by the shock or from the radiatively accelerated dense CSM near the progenitor. We also found narrow features near the line center of He I 1.083 μm at 47, 67, and 71 d. The intermediate-width and narrow features in NIR lines persist longer than their optical counterparts, which mostly disappeared by 18 d. The temporal evolution of interaction features continues a few tens of days after the explosion; this indicates that it is crucial to view CSM as a product of a complex mass loss history of the progenitor.
2. We found high-velocity (∼5000–15 000 km s−1) absorption features (a.k.a. “cachitos”) in H α and H β from 36 d to 71 d after the explosion. These high-velocity features imply interaction between high-velocity ejecta and an RSG wind.
3. In the final eight epochs (t = 199 − 307 d), the continuum is flattened at 1.5 − 2.5 μm due to early dust formation, which accompanied CO first overtone emission at λ = 2.3 − 2.5 μm. Using a LTE model for the CO emission and a modified black body emission for the dust continuum, we fit the CO emission and estimate the CO temperature, CO velocity, CO mass, dust temperature, and dust mass for each epoch. We compare our models with various models including those with non-LTE populations of neutral and singly ionized CO and discuss the discrepancies between our best-fit models and observation. We also compare the CO properties of SN 2023ixf with those of other SNe II, SN 2017eaw and SN 1987A, at similar evolutionary phases. We find that while the CO temperatures of SN 2023ixf at 250 − 300 d are comparable to those of SN 2017eaw at similar evolutionary phases, the CO velocities are much higher, suggesting diversity in CO and dust formation.
We find that models with only neutral 12C16O are able to reproduce the CO spectra of SN 2023ixf. Previous model NIR spectra of other SNe (e.g., liu92,rho21) that included non-LTE energy distributions and CO+ ions were able to reproduce observed CO+ emission at shorter (λ ≲ 2.3 μm) wavelengths. We discuss the limitations of the single dust component assumption in our models in Section 3.6. Further studies, including non-thermal processes, are encouraged to gain a better understanding of the phenomenon.
Data availability
The optical and NIR spectra presented in this paper are available via WISeREP3 archive (Yaron & Gal-Yam 2012).
Acknowledgments
Based on observations obtained at the international Gemini Observatory, a program of NSF NOIRLab, which is managed by the Association of Universities for Research in Astronomy (AURA) under a cooperative agreement with the U.S. National Science Foundation on behalf of the Gemini Observatory partnership: the U.S. National Science Foundation (United States), National Research Council (Canada), Agencia Nacional de Investigación y Desarrollo (Chile), Ministerio de Ciencia, Tecnología e Innovación (Argentina), Ministério da Ciência, Tecnologia, Inovações e Comunicações (Brazil), and Korea Astronomy and Space Science Institute (Republic of Korea). We thank Gemini staff for supporting the Gemini GNIRS observations. The University of Arizona team would like to thank J. Hinz, G. Williams, and the rest of the MMT staff for enabling and supporting the MMIRS observations reported here. This work makes use of observations from the Las Cumbres Observatory network. S.H.P. and S.-C.Y. were supported by the National Research Foundation of Korea (NRF) NRF-2019R1A2C2010885 and NRF-2022H1D3A2A01096434. S.-C. Y. was supported by the NRF RS-2024-00356267. J.R. was partially supported by a NASA ADAP grant (80NSSC23K0749), JWST-GO-01947.032, and Brain Pool visiting program for Outstanding Overseas Researchers by NRF-2022H1D3A2A01096434. The LCO team is supported by NSF grants AST-1911225 and AST-1911151. Time-domain research by the University of Arizona team and D.J.S. is supported by National Science Foundation (NSF) grants 2108032, 2308181, 2407566, and 2432036 and the Heising-Simons Foundation under grant #2020-1864. C.L. acknowledges support from the National Science Foundation Graduate Research Fellowship under Grant No. DGE-2233066 and DOE award DE-SC0010008 to Rutgers University. K.A.B is supported by an LSST-DA Catalyst Fellowship; this publication was thus made possible through the support of Grant 62192 from the John Templeton Foundation to LSST-DA. L.G. acknowledges financial support from AGAUR, CSIC, MCIN and AEI 10.13039/501100011033 under projects PID2023-151307NB-I00, PIE 20215AT016, CEX2020-001058-M, and 2021-SGR-01270. Observations reported here were obtained at the MMT Observatory, a joint facility of the University of Arizona and the Smithsonian Institution. Observations reported here were taken at the Infrared Telescope Facility, which is operated by the University of Hawaii under contract 80HQTR24DA010 with the National Aeronautics and Space Administration. This research is based in part on observations obtained at the international Gemini Observatory, a program of NSF’s NOIRLab, which is managed by the Association of Universities for Research in Astronomy (AURA) under a cooperative agreement with the National Science Foundation on behalf of the Gemini Observatory partnership: the National Science Foundation (United States), National Research Council (Canada), Agencia Nacional de Investigación y Desarrollo (Chile), Ministerio de Ciencia, Tecnología e Innovación (Argentina), Ministério da Ciência, Tecnologia, Inovações e Comunicações (Brazil), and Korea Astronomy and Space Science Institute (Republic of Korea). Some of the data presented herein were obtained at Keck Observatory, which is a private 501(c)3 non-profit organization operated as a scientific partnership among the California Institute of Technology, the University of California, and the National Aeronautics and Space Administration. The Observatory was made possible by the generous financial support of the W. M. Keck Foundation. The authors wish to recognize and acknowledge the very significant cultural role and reverence that the summit of Maunakea has always had within the Native Hawaiian community. We are most fortunate to have the opportunity to conduct observations from this mountain. S.H.P. thanks the developers of the following softwares and packages that were used in this work: Astropy (Astropy Collaboration 2013, 2018, 2022), numpy (Harris et al. 2020), scipy (Virtanen et al. 2020), XDGNIRS (Mason et al. 2015), FLOYDS pipeline (Valenti et al. 2014), MMIRS pipeline (Chilingarian et al. 2015), XTELLCOR (Cushing et al. 2004), Spextool (Cushing et al. 2004), pypeit pipeline (Prochaska et al. 2020b,a), YSE-PZ (Coulter et al. 2022, 2023), kmpfit (Terlouw & Vogelaar 2014), matplotlib (Hunter 2007)
References
- Anderson, J. P., Dessart, L., Gutierrez, C. P., et al. 2014, MNRAS, 441, 671 [NASA ADS] [CrossRef] [Google Scholar]
- Andrews, J. E., Gallagher, J. S., Clayton, G. C., et al. 2010, ApJ, 715, 541 [Google Scholar]
- Andrews, J. E., Clayton, G. C., Wesson, R., et al. 2011, AJ, 142, 45 [NASA ADS] [CrossRef] [Google Scholar]
- Andrews, J. E., Smith, N., McCully, C., et al. 2017, MNRAS, 471, 4047 [Google Scholar]
- Andrews, J. E., Pearson, J., Hosseinzadeh, G., et al. 2024, ApJ, 965, 85 [CrossRef] [Google Scholar]
- Arnett, W. D., Bahcall, J. N., Kirshner, R. P., & Woosley, S. E. 1989, ARA&A, 27, 629 [NASA ADS] [CrossRef] [Google Scholar]
- Astropy Collaboration (Robitaille, T. P., et al.) 2013, A&A, 558, A33 [NASA ADS] [CrossRef] [EDP Sciences] [Google Scholar]
- Astropy Collaboration (Price-Whelan, A. M., et al.) 2018, AJ, 156, 123 [Google Scholar]
- Astropy Collaboration (Price-Whelan, A. M., et al.) 2022, ApJ, 935, 167 [NASA ADS] [CrossRef] [Google Scholar]
- Banerjee, D. P. K., Srivastava, M. K., Ashok, N. M., & Venkataraman, V. 2016, MNRAS, 455, L109 [Google Scholar]
- Banerjee, D. P. K., Joshi, V., Evans, A., et al. 2018, MNRAS, 481, 806 [CrossRef] [Google Scholar]
- Bersten, M. C., Orellana, M., Folatelli, G., et al. 2024, A&A, 681, L18 [NASA ADS] [CrossRef] [EDP Sciences] [Google Scholar]
- Bostroem, K. A., Pearson, J., Shrestha, M., et al. 2023, ApJ, 956, L5 [NASA ADS] [CrossRef] [Google Scholar]
- Branch, D. 1987, ApJ, 320, L121 [Google Scholar]
- Cami, J., Bernard-Salas, J., Peeters, E., & Malek, S. E. 2010, Science, 329, 1180 [NASA ADS] [CrossRef] [Google Scholar]
- Cherchneff, I., & Dwek, E. 2009, ApJ, 703, 642 [NASA ADS] [CrossRef] [Google Scholar]
- Chilingarian, I., Beletsky, Y., Moran, S., et al. 2015, PASP, 127, 406 [CrossRef] [Google Scholar]
- Chugai, N. N. 2021, MNRAS, 504, 2014 [Google Scholar]
- Chugai, N. N., Blinnikov, S. I., Fassia, A., et al. 2002, MNRAS, 330, 473 [NASA ADS] [CrossRef] [Google Scholar]
- Chugai, N. N., Blinnikov, S. I., Cumming, R. J., et al. 2004, MNRAS, 352, 1213 [NASA ADS] [CrossRef] [Google Scholar]
- Chugai, N. N., Chevalier, R. A., & Utrobin, V. P. 2007, ApJ, 662, 1136 [NASA ADS] [CrossRef] [Google Scholar]
- Coulter, D. A., Jones, D. O., McGill, P., et al. 2022, https://doi.org/10.5281/zenodo.7278430 [Google Scholar]
- Coulter, D. A., Jones, D. O., McGill, P., et al. 2023, PASP, 135, 064501 [Google Scholar]
- Cushing, M. C., Vacca, W. D., & Rayner, J. T. 2004, PASP, 116, 362 [NASA ADS] [CrossRef] [Google Scholar]
- Dastidar, R., Pignata, G., Dukiya, N., et al. 2024, A&A, 685, A44 [NASA ADS] [CrossRef] [EDP Sciences] [Google Scholar]
- Davis, S., Hsiao, E. Y., Ashall, C., et al. 2019, ApJ, 887, 4 [NASA ADS] [CrossRef] [Google Scholar]
- de Jaeger, T., Zheng, W., Stahl, B. E., et al. 2019, MNRAS, 490, 2799 [NASA ADS] [CrossRef] [Google Scholar]
- De Looze, I., Barlow, M. J., Swinyard, B. M., et al. 2017, MNRAS, 465, 3309 [NASA ADS] [CrossRef] [Google Scholar]
- De Looze, I., Barlow, M. J., Bandiera, R., et al. 2019, MNRAS, 488, 164 [NASA ADS] [CrossRef] [Google Scholar]
- DerKacy, J. M., Ashall, C., Baron, E., et al. 2025, ApJ, in press [arXiv:2507.18785] [Google Scholar]
- Dessart, L., & Hillier, D. J. 2005, A&A, 437, 667 [NASA ADS] [CrossRef] [EDP Sciences] [Google Scholar]
- Dessart, L., & Hillier, D. J. 2019, A&A, 625, A9 [NASA ADS] [CrossRef] [EDP Sciences] [Google Scholar]
- Dwek, E., Galliano, F., & Jones, A. P. 2007, ApJ, 662, 927 [NASA ADS] [CrossRef] [Google Scholar]
- Fedkin, A. V., Meyer, B. S., & Grossman, L. 2010, Geochim. Cosmochim. Acta, 74, 3642 [Google Scholar]
- Filippenko, A. V. 1982, PASP, 94, 715 [Google Scholar]
- Fransson, C., Ergon, M., Challis, P. J., et al. 2014, ApJ, 797, 118 [Google Scholar]
- Fuller, J. 2017, MNRAS, 470, 1642 [NASA ADS] [CrossRef] [Google Scholar]
- Gall, C., Hjorth, J., & Andersen, A. C. 2011, A&ARv, 19, 43 [NASA ADS] [CrossRef] [Google Scholar]
- Gall, C., Hjorth, J., Watson, D., et al. 2014, Nature, 511, 326 [CrossRef] [Google Scholar]
- Goorvitch, D. 1994, ApJS, 95, 535 [NASA ADS] [CrossRef] [Google Scholar]
- Grefenstette, B. W., Brightman, M., Earnshaw, H. P., Harrison, F. A., & Margutti, R. 2023, ApJ, 952, L3 [NASA ADS] [CrossRef] [Google Scholar]
- Gutiérrez, C. P., Anderson, J. P., Hamuy, M., et al. 2017, ApJ, 850, 89 [CrossRef] [Google Scholar]
- Harris, C. R., Millman, K. J., van der Walt, S. J., et al. 2020, Nature, 585, 357 [NASA ADS] [CrossRef] [Google Scholar]
- Hiramatsu, D., Howell, D. A., Moriya, T. J., et al. 2021, ApJ, 913, 55 [CrossRef] [Google Scholar]
- Hiramatsu, D., Tsuna, D., Berger, E., et al. 2023, ApJ, 955, L8 [NASA ADS] [CrossRef] [Google Scholar]
- Hosseinzadeh, G., Farah, J., Shrestha, M., et al. 2023, ApJ, 953, L16 [NASA ADS] [CrossRef] [Google Scholar]
- Hsu, B., Smith, N., Goldberg, J. A., et al. 2025, ApJ, 990, 148 [Google Scholar]
- Hunter, J. D. 2007, Comput. Sci. Eng., 9, 90 [NASA ADS] [CrossRef] [Google Scholar]
- Itagaki, K. 2023, Transient Name Server Discovery Report, 2023–1158, 1 [Google Scholar]
- Jacobson-Galán, W. V., Dessart, L., Margutti, R., et al. 2023, ApJ, 954, L42 [CrossRef] [Google Scholar]
- Jacobson-Galán, W. V., Dessart, L., Kilpatrick, C. D., et al. 2025, ApJ, in press [arXiv:2508.11747] [Google Scholar]
- Jencson, J. E., Pearson, J., Beasor, E. R., et al. 2023, ApJ, 952, L30 [NASA ADS] [CrossRef] [Google Scholar]
- Kilpatrick, C. D., Foley, R. J., Jacobson-Galán, W. V., et al. 2023, ApJ, 952, L23 [NASA ADS] [CrossRef] [Google Scholar]
- Kotak, R., Meikle, W. P. S., Farrah, D., et al. 2009, ApJ, 704, 306 [NASA ADS] [CrossRef] [Google Scholar]
- Kumar, A., Dastidar, R., Maund, J. R., Singleton, A. J., & Sun, N.-C. 2025, MNRAS, 538, 659 [Google Scholar]
- Leonard, D. C., Filippenko, A. V., Gates, E. L., et al. 2002, PASP, 114, 35 [Google Scholar]
- Leśniewska, A., & Michałowski, M. J. 2019, A&A, 624, L13 [Google Scholar]
- Liu, W., Dalgarno, A., & Lepp, S. 1992, ApJ, 396, 679 [NASA ADS] [CrossRef] [Google Scholar]
- Martinez, L., Bersten, M. C., Folatelli, G., Orellana, M., & Ertini, K. 2024, A&A, 683, A154 [NASA ADS] [CrossRef] [EDP Sciences] [Google Scholar]
- Mason, R. E., Rodríguez-Ardila, A., Martins, L., et al. 2015, ApJS, 217, 13 [NASA ADS] [CrossRef] [Google Scholar]
- Matsuura, M., Dwek, E., Barlow, M. J., et al. 2015, ApJ, 800, 50 [NASA ADS] [CrossRef] [Google Scholar]
- McLeod, B., Fabricant, D., Nystrom, G., et al. 2012, PASP, 124, 1318 [NASA ADS] [CrossRef] [Google Scholar]
- Medler, K., Ashall, C., Hoeflich, P., et al. 2025, ApJ, in press [arXiv:2507.19727] [Google Scholar]
- Meikle, W. P. S., Allen, D. A., Spyromilio, J., & Varani, G. F. 1989, MNRAS, 238, 193 [NASA ADS] [CrossRef] [Google Scholar]
- Meikle, W. P. S., Kotak, R., Farrah, D., et al. 2011, ApJ, 732, 109 [Google Scholar]
- Michałowski, M., Hjorth, J., & Watson, D. 2010, A&A, 514, A67 [NASA ADS] [CrossRef] [EDP Sciences] [Google Scholar]
- Morgan, H. L., & Edmunds, M. G. 2003, MNRAS, 343, 427 [CrossRef] [Google Scholar]
- Moriya, T. J., Pruzhinskaya, M. V., Ergon, M., & Blinnikov, S. I. 2016, MNRAS, 455, 423 [Google Scholar]
- Morozova, V., Piro, A. L., & Valenti, S. 2017, ApJ, 838, 28 [NASA ADS] [CrossRef] [Google Scholar]
- Neustadt, J. M. M., Kochanek, C. S., & Smith, M. R. 2024, MNRAS, 527, 5366 [Google Scholar]
- Perley, D. A., Gal-Yam, A., Irani, I., & Zimmerman, E. 2023, Transient Name Server AstroNote, 119, 1 [NASA ADS] [Google Scholar]
- Priestley, F. D., Barlow, M. J., & De Looze, I. 2019, MNRAS, 485, 440 [Google Scholar]
- Priestley, F. D., Barlow, M. J., De Looze, I., & Chawner, H. 2020, MNRAS, 491, 6020 [NASA ADS] [CrossRef] [Google Scholar]
- Priestley, F. D., Arias, M., Barlow, M. J., & De Looze, I. 2022, MNRAS, 509, 3163 [Google Scholar]
- Prochaska, J., Hennawi, J., Westfall, K., et al. 2020a, J. Open Source Softw., 5, 2308 [NASA ADS] [CrossRef] [Google Scholar]
- Prochaska, J. X., Hennawi, J., Cooke, R., et al. 2020b, https://doi.org/10.5281/zenodo.3743493 [Google Scholar]
- Ransome, C. L., Villar, V. A., Tartaglia, A., et al. 2024, ApJ, 965, 93 [CrossRef] [Google Scholar]
- Ravi, A. P., Rho, J., Park, S., et al. 2023, ApJ, 950, 14 [CrossRef] [Google Scholar]
- Ravi, A. P., Valenti, S., Dong, Y., et al. 2025, ApJ, 982, 12 [Google Scholar]
- Rayner, J. T., Toomey, D. W., Onaka, P. M., et al. 2003, PASP, 115, 362 [NASA ADS] [CrossRef] [Google Scholar]
- Rho, J., Geballe, T. R., Banerjee, D. P. K., et al. 2018a, ApJ, 864, L20 [Google Scholar]
- Rho, J., Gomez, H. L., Boogert, A., et al. 2018b, MNRAS, 479, 5101 [NASA ADS] [CrossRef] [Google Scholar]
- Rho, J., Evans, A., Geballe, T. R., et al. 2021, ApJ, 908, 232 [NASA ADS] [CrossRef] [Google Scholar]
- Rho, J., Park, S. H., Arendt, R., et al. 2024, ApJ, 969, L9 [Google Scholar]
- Riess, A. G., Yuan, W., Macri, L. M., et al. 2022, ApJ, 934, L7 [NASA ADS] [CrossRef] [Google Scholar]
- Rothman, L. S., Jacquemart, D., Barbe, A., et al. 2005, J. Quant. Spectr. Rad. Transf., 96, 139 [NASA ADS] [CrossRef] [Google Scholar]
- Sakon, I., Onaka, T., Wada, T., et al. 2009, ApJ, 692, 546 [Google Scholar]
- Sarangi, A., & Cherchneff, I. 2013, ApJ, 776, 107 [NASA ADS] [CrossRef] [Google Scholar]
- Sarangi, A., & Cherchneff, I. 2015, A&A, 575, A95 [NASA ADS] [CrossRef] [EDP Sciences] [Google Scholar]
- Singh, A., Teja, R. S., Moriya, T. J., et al. 2024, ApJ, 975, 132 [CrossRef] [Google Scholar]
- Sluder, A., Milosavljević, M., & Montgomery, M. H. 2018, MNRAS, 480, 5580 [NASA ADS] [Google Scholar]
- Smith, N., Chornock, R., Silverman, J. M., Filippenko, A. V., & Foley, R. J. 2010, ApJ, 709, 856 [NASA ADS] [CrossRef] [Google Scholar]
- Smith, N., Pearson, J., Sand, D. J., et al. 2023, ApJ, 956, 46 [NASA ADS] [CrossRef] [Google Scholar]
- Soraisam, M. D., Szalai, T., Van Dyk, S. D., et al. 2023, ApJ, 957, 64 [NASA ADS] [CrossRef] [Google Scholar]
- Spyromilio, J., Meikle, W. P. S., Learner, R. C. M., & Allen, D. A. 1988, Nature, 334, 327 [Google Scholar]
- Szalai, T., Vinkó, J., Balog, Z., et al. 2011, A&A, 527, A61 [NASA ADS] [CrossRef] [EDP Sciences] [Google Scholar]
- Takáts, K., Pumo, M. L., Elias-Rosa, N., et al. 2014, MNRAS, 438, 368 [CrossRef] [Google Scholar]
- Teja, R. S., Singh, A., Basu, J., et al. 2023, ApJ, 954, L12 [NASA ADS] [CrossRef] [Google Scholar]
- Temim, T., Dwek, E., Arendt, R. G., et al. 2017, ApJ, 836, 129 [NASA ADS] [CrossRef] [Google Scholar]
- Terlouw, J. P., & Vogelaar, M. G. R. 2014, Kapteyn Package, version 3.4, Kapteyn Astronomical Institute, Groningen, available from http://www.astro.rug.nl/software/kapteyn/ [Google Scholar]
- Terreran, G., Jacobson-Galán, W. V., Groh, J. H., et al. 2022, ApJ, 926, 20 [NASA ADS] [CrossRef] [Google Scholar]
- Tinyanont, S., Foley, R. J., Taggart, K., et al. 2024, PASP, 136, 014201P [Google Scholar]
- Tinyanont, S., Kasliwal, M. M., Krafton, K., et al. 2019, ApJ, 873, 127 [NASA ADS] [CrossRef] [Google Scholar]
- Tsuna, D., Murase, K., & Moriya, T. J. 2023, ApJ, 952, 115 [NASA ADS] [CrossRef] [Google Scholar]
- Vacca, W. D., Cushing, M. C., & Rayner, J. T. 2003, PASP, 115, 389 [NASA ADS] [CrossRef] [Google Scholar]
- Valenti, S., Sand, D., Pastorello, A., et al. 2014, MNRAS, 438, L101 [Google Scholar]
- Valenti, S., Howell, D. A., Stritzinger, M. D., et al. 2016, MNRAS, 459, 3939 [NASA ADS] [CrossRef] [Google Scholar]
- Van Dyk, S. D., Srinivasan, S., Andrews, J. E., et al. 2024, ApJ, 968, 27 [NASA ADS] [CrossRef] [Google Scholar]
- Virtanen, P., Gommers, R., Oliphant, T. E., et al. 2020, Nat. Methods, 17, 261 [Google Scholar]
- Wesson, R., & Bevan, A. 2021, ApJ, 923, 148 [NASA ADS] [CrossRef] [Google Scholar]
- Wilson, J. C., Henderson, C. P., Herter, T. L., et al. 2004, in Ground-based Instrumentation for Astronomy, eds. A. F. M. Moorwood, & M. Iye, SPIE Conf. Ser., 5492, 1295 [Google Scholar]
- Wooden, D. H., Rank, D. M., Bregman, J. D., et al. 1993, ApJS, 88, 477 [NASA ADS] [CrossRef] [Google Scholar]
- Yamanaka, M., Fujii, M., & Nagayama, T. 2023, PASJ, 75, L27 [NASA ADS] [CrossRef] [Google Scholar]
- Yaron, O., & Gal-Yam, A. 2012, PASP, 124, 668 [Google Scholar]
- Zimmerman, E. A., Irani, I., Chen, P., et al. 2024, Nature, 627, 759 [Google Scholar]
Appendix A: Additional figures
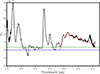 |
Fig. A.1. CO first overtone emission of SN 2017eaw at 169 d since the explosion compared to the LTE emission model described in the text (red dotted). We demonstrate the possibility of different continua with a lower limit (blue dotted) and an upper limit (green dotted) of the continuum. |
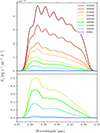 |
Fig. A.2. CO LTE model spectra for a given velocity of 3000 km s−1 and a range of temperatures between 800 and 3500 K. Higher CO temperature shows clearer band heads. Lack of distinct spectral features due to band heads from υ = 3 and higher vibrational levels indicates the CO temperature < 2300 K. |
All Tables
All Figures
|
Fig. 1. Gemini/GNIRS (17, 37, 67, 249, and 277 d; blue), Keck/NIRES (9, 19, 47, 71, 259, and 275 d; black), IRTF/SpeX (39, 278, and 307 d; green), and MMT/MMIRS (199 and 257 d; red) spectra of SN 2023ixf in time order (top to bottom). Each spectrum is labeled with the days elapsed after the explosion. The wavelengths of known strong lines (e.g., Meikle et al. 1989) are marked with dotted lines. Regions with significant noise due to strong telluric absorption are shaded in gray. The wavelength region of the first overtone CO emission is shaded in light blue. We also include Paschen α (1.875 μm), which falls in a region of poor telluric transmission, marked by a black dotted line. The Brackett δ and ϵ lines, which also fall in the region, are artifacts due to incomplete removal of the same lines in the standard stars, despite appearing to be present in some of the spectra. |
| In the text | |
|
Fig. 2. (a) Velocity profiles of He I 1.083 μm from 9 to 71 d. Lines identified from IW features (FWHM ∼ 1000 km s−1) are marked with black dotted vertical lines. The inset at the bottom right corner shows narrow (FWHM ∼ 100 km s−1) features at 47, 67, and 71 d, near the zero velocity of He I 1.083 μm. Black boxes connected via black dashed lines indicate the velocity of absorption troughs of broad P Cygni profiles. (b) Velocity profiles of Pa β 1.282 μm and Br γ 2.166 μm from selected epochs. The Pa β line shows an IW feature at 9 d, and the Br γ line shows IW features at 17 and 39 d. See Table 2 for the FWHMs and the shifts from zero velocity of the IW and narrow lines under the columns labeled “Narrow line.” Table 2 also show the velocity shifts of broad absorption, and the velocity interval between minimum and maximum of P Cygni profile. |
| In the text | |
|
Fig. 3. Line profiles of H α(a) and H β(b) of SN 2023ixf. Of particular interest are a “dip” (“B” marked in red) on the blue side of the profile with velocities of ∼−6000 km s−1 at 57, 67, and 71 d, and a weak absorption feature (“A” marked in black with boxes) at high velocity (−12 000 km s−1) between 27 and 57 d (see Leonard et al. 2002, also the HV in SN 1999em). These features (indicated by arrows and labeled “A” and “B”) are called “Cahitos” (see Gutiérrez et al. 2017). These feature are caused by interactions, geometry, and viewing angles between the reverse shock, the CSM and ejecta (Chugai et al. 2004). The epochs are labeled on the right. The inset at the bottom right corner shows “A” cachito features at 36, 39, 40, and 47 d. The absorption-like features at 14 000 km s−1 in H α are due to telluric absorption. |
| In the text | |
|
Fig. 4. Multi-component line fitting of He I 1.083 μm (a) and Pa β 1.282 μm (b) at 9 d with with Gaussian and Lorentzian components. The He I 1.083 μm line profile (a) was fitted with two broad Gaussian profiles with FWHMs of 5250 and 6010 km s−1 for absorption and emission, along with two intermediate-width (IW) Gaussian profiles with FWHMs of 1000 and 670 km s−1 for absorption and emission. The Pa γ 1.094 μm that overlaps the He I 1.083 μm was simultaneously fitted with an intermediate-width Gaussian profile with FWHM of 980 km s−1. The Pa β 1.282 μm line profile (b) was fitted with two broad Gaussian profiles with FWHMs of 4790 and 5150 km s−1 for absorption and emission, respectively, and an intermediate-width Lorentzian emission profile with FWHM of 720 km s−1 (red). |
| In the text | |
|
Fig. 5. Observed line first-overtone bands in SN 2023ixf from 249 to 307 d are superposed with the best LTE model fits (black dashed). A linear continuum was adopted for each spectrum. More details are provided in the text. The best-fit parameter values are presented in Table 1. |
| In the text | |
|
Fig. 6. Spectra of SN 2023ixf at 199 d and 249 d compared with those of Type IIP SN 2017eaw at 205 d and Type Ic SN 2020oi at 63 d. All spectra are shifted back to z = 0, and the spectra of SN 2017eaw and SN 2020oi are multiplied with constants for visual comparison. Rest wavelengths of the CO first overtone emission band heads for 2–0, 3–1, 4–2, 5–3, 6–4, 7–5, and 8–6 transitions are 2.294, 2.323, 2.353, 2.383, 2.414, 2.446, and 2.479 μm, respectively (marked as thick black lines). |
| In the text | |
|
Fig. 7. Spectrum of SN 2023ixf at 277 d compared with that of Type II-pec SN 1987A at 283 d. SN 2023ixf shows a sharp rise at 2.29 μm due to the CO R branch’s υ = 2 − 0 R branch and additional emission extending at least to 2.45 μm, due to lines of both the CO R and P branches. In contrast, SN 1987A shows structures near 2.30 μm and 2.33 μm due to the CO 2 − 0 and 3 − 1 band heads with extended emission at longer wavelength due to lines from both the CO R and P branches. |
| In the text | |
|
Fig. A.1. CO first overtone emission of SN 2017eaw at 169 d since the explosion compared to the LTE emission model described in the text (red dotted). We demonstrate the possibility of different continua with a lower limit (blue dotted) and an upper limit (green dotted) of the continuum. |
| In the text | |
|
Fig. A.2. CO LTE model spectra for a given velocity of 3000 km s−1 and a range of temperatures between 800 and 3500 K. Higher CO temperature shows clearer band heads. Lack of distinct spectral features due to band heads from υ = 3 and higher vibrational levels indicates the CO temperature < 2300 K. |
| In the text | |
Current usage metrics show cumulative count of Article Views (full-text article views including HTML views, PDF and ePub downloads, according to the available data) and Abstracts Views on Vision4Press platform.
Data correspond to usage on the plateform after 2015. The current usage metrics is available 48-96 hours after online publication and is updated daily on week days.
Initial download of the metrics may take a while.