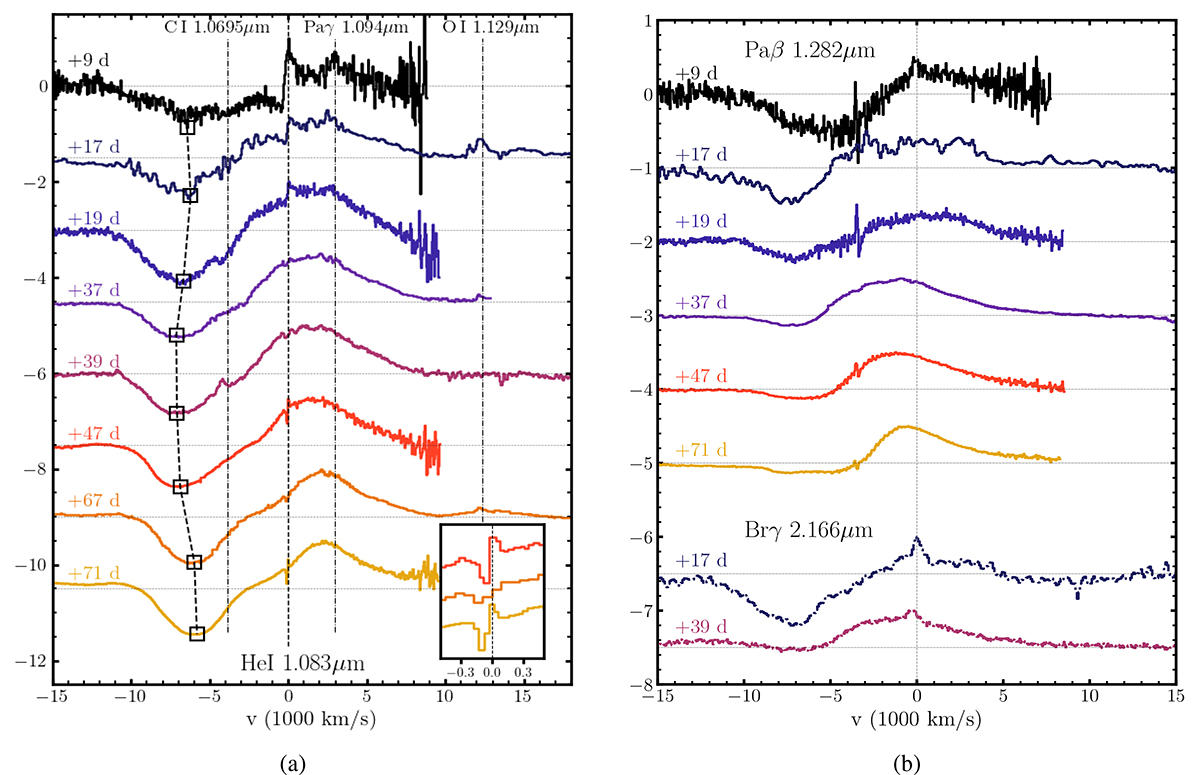
Fig. 2.
Download original image
(a) Velocity profiles of He I 1.083 μm from 9 to 71 d. Lines identified from IW features (FWHM ∼ 1000 km s−1) are marked with black dotted vertical lines. The inset at the bottom right corner shows narrow (FWHM ∼ 100 km s−1) features at 47, 67, and 71 d, near the zero velocity of He I 1.083 μm. Black boxes connected via black dashed lines indicate the velocity of absorption troughs of broad P Cygni profiles. (b) Velocity profiles of Pa β 1.282 μm and Br γ 2.166 μm from selected epochs. The Pa β line shows an IW feature at 9 d, and the Br γ line shows IW features at 17 and 39 d. See Table 2 for the FWHMs and the shifts from zero velocity of the IW and narrow lines under the columns labeled “Narrow line.” Table 2 also show the velocity shifts of broad absorption, and the velocity interval between minimum and maximum of P Cygni profile.
Current usage metrics show cumulative count of Article Views (full-text article views including HTML views, PDF and ePub downloads, according to the available data) and Abstracts Views on Vision4Press platform.
Data correspond to usage on the plateform after 2015. The current usage metrics is available 48-96 hours after online publication and is updated daily on week days.
Initial download of the metrics may take a while.