Fig. 1.
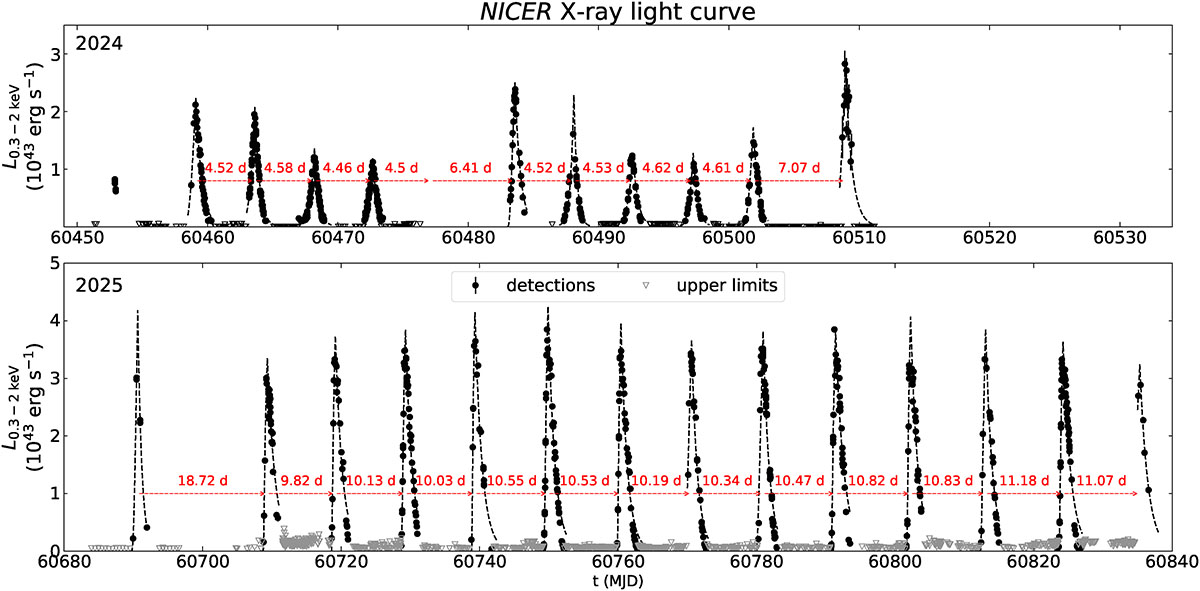
Download original image
NICER X-ray light curve of Ansky for the period May 19–July 20, 2024 (upper panel). Detections are plotted as black circles, and non-detections as gray triangles. The typical peak-to-peak timescale is ∼4.5 days; these QPEs were presented in Hernández-García et al. (2025). NICER light curve between January 7 and March 30, 2025 (bottom panel). The typical peak-to-peak timescale is ∼10 days. Note that there are no observations around MJD 60700, so there might be a missing flare. The dashed lines represent exponential rise and decay profiles fit to each QPE (see Sect. 3). The horizontal axis spans an equal number of days in 2024 and 2025 to facilitate timescale comparison.
Current usage metrics show cumulative count of Article Views (full-text article views including HTML views, PDF and ePub downloads, according to the available data) and Abstracts Views on Vision4Press platform.
Data correspond to usage on the plateform after 2015. The current usage metrics is available 48-96 hours after online publication and is updated daily on week days.
Initial download of the metrics may take a while.