| Issue |
A&A
Volume 703, November 2025
|
|
|---|---|---|
| Article Number | A263 | |
| Number of page(s) | 7 | |
| Section | Extragalactic astronomy | |
| DOI | https://doi.org/10.1051/0004-6361/202555258 | |
| Published online | 18 November 2025 | |
NICER observations reveal doubled timescales in Ansky’s quasi-periodic eruptions
1
Millennium Nucleus on Transversal Research and Technology to Explore Supermassive Black Holes (TITANS), Gran Bretaña 1111, Playa Ancha, Valparaíso, Chile
2
Millennium Institute of Astrophysics (MAS), Nuncio Monseñor Sótero Sanz 100, Providencia, Santiago, Chile
3
Instituto de Estudios Astrofísicos, Facultad de Ingeniería y Ciencias, Universidad Diego Portales, Av. Ejército Libertador 441, Santiago, Chile
4
Centro Interdisciplinario de Data Science, Facultad de Ingeniería y Ciencias, Universidad Diego Portales, Av. Ejército Libertador 441, Santiago, Chile
5
European Southern Observatory, Karl-Schwarzschild-Strasse 2, 85748 Garching bei München, Germany
6
MIT Kavli Institute for Astrophysics and Space Research, Massachusetts Institute of Technology, Cambridge, MA 02139, USA
7
Departamento de Ciencias, Facultad de Artes Liberales, Universidad Adolfo Ibáñez, Av. Padre Hurtado 750, Viña del Mar, Chile
8
Centro de Astrobiología (CAB), CSIC-INTA, Camino Bajo del Castillo s/n, 28692 Villanueva de la Cañada, Madrid, Spain
9
Instituto de Física y Astronomía, Facultad de Ciencias, Universidad de Valparaíso, Gran Bretaña 1111, Playa Ancha, Valparaíso, Chile
10
Department of Astronomy,University of Geneva, Ch. d’Ecogia 16, 1290 Versoix, Switzerland
11
Kavli Institute for Astronomy and Astrophysics, Peking University, Beijing 100871, PR China
12
X-ray Astrophysics Laboratory, Code 662, NASA Goddard Space Flight Center, Greenbelt, MD 20771, USA
13
Departamento de Astronomía, Universidad de Chile, Casilla 36D, Santiago, Chile
⋆ Corresponding author: This email address is being protected from spambots. You need JavaScript enabled to view it.
Received:
22
April
2025
Accepted:
17
September
2025
Abstract
Quasi-periodic eruptions (QPEs) are recurring X-ray bursts originating from the vicinity of supermassive black holes, but their driving mechanisms remain under debate. This study analyzes new NICER observations of QPEs in Ansky (a transient event in the nucleus of the galaxy SDSS J1335+0728), taken between January and June 2025. By examining flare durations, peak-to-peak recurrence times, and profiles, we compare the 2025 data with those from 2024 to investigate changes in energy, timescales, and flare shapes. The 2025 QPEs are found to be four times more energetic, with recurrence times of approximately 10 days and flare durations ranging from 2.5 to 4 days, making them both about twice as long as in 2024. Additionally, the flare profiles have become more asymmetric, showing longer decays. We explore different theoretical scenarios to explain the observed properties of the QPEs in Ansky, including evolving stream–disk interactions in an extreme mass-ratio inspiral system as a potential mechanism behind the observed changes in recurrence time and energetics, while also considering alternative models based on mass transfer and accretion disk instabilities. Continued observational efforts will be crucial for unveiling the nature of Ansky.
Key words: galaxies: active / galaxies: individual: SDSS1335+0728 / galaxies: nuclei / X-rays: individuals: Ansky
NHFP Einstein Fellow.
© The Authors 2025
 Open Access article, published by EDP Sciences, under the terms of the Creative Commons Attribution License (https://creativecommons.org/licenses/by/4.0), which permits unrestricted use, distribution, and reproduction in any medium, provided the original work is properly cited.
This article is published in open access under the Subscribe to Open model. This email address is being protected from spambots. You need JavaScript enabled to view it. to support open access publication.
1. Introduction
Quasi-periodic eruptions (QPEs) are luminous (L ∼ 1042 − 44 erg s−1) recurring (P ∼ 2.5 h–4.5 days) fast (ΔT ∼ 0.5 h–1.5 days) and soft X-ray transients from supermassive black holes (SMBHs) in galactic nuclei (Miniutti et al. 2019; Giustini et al. 2020; Arcodia et al. 2021, 2024a, 2025; Chakraborty et al. 2021, 2025a; Quintin et al. 2023; Nicholl et al. 2024; Hernández-García et al. 2025). Despite dedicated searches for QPE counterparts in radio and UV bands (Miniutti et al. 2019; Giustini et al. 2024; Wevers et al. 2025), QPEs have so far been uniquely observed in soft X-rays. They exhibit thermal X-ray spectra with evolving temperatures of kT ∼ 80 − 250 eV, and they are typically superimposed on quiescence emission from a disk blackbody with temperatures Tin ∼ 40 − 80 eV. All QPEs exhibit a characteristic counterclockwise hysteresis cycle in the Lbol − T plane with rises hotter than decays. Assuming a simple blackbody model for the QPE emission, the evolution suggests an expanding emitting region with a typical size of the order of one solar radius (Arcodia et al. 2022; Miniutti et al. 2023; Quintin et al. 2023; Giustini et al. 2024; Nicholl et al. 2024; Hernández-García et al. 2025; Chakraborty et al. 2025a). The timing behavior of the different QPE sources is diverse, with some sources showing a regular pattern (e.g., GSN 069 or eRO-QPE2; see Miniutti et al. 2023; Arcodia et al. 2024b) and others having more complex or even erratic time series (e.g., RX J1301.9+2747 or AT2022upj, as discussed by Giustini et al. 2024; Chakraborty et al. 2025a).
Several lines of evidence point toward a connection between QPEs and transient events such as tidal disruption events (TDEs), suggesting that QPEs are detected after the TDE optical and/or UV peak, possibly in as many as  % of TDEs (Chakraborty et al. 2025a), although the latter estimate is subject to large uncertainties mostly due to the consistently low number statistics. The detection of QPEs months to years after transient events – AT2019vcb, XMMSL1 J024, AT2019qiz, AT2022upj, and ZTF19acnskyy (“Ansky”) – constitutes some of the clearest evidence for a QPE-transient event connection (Miniutti et al. 2023; Guolo et al. 2025; Quintin et al. 2023; Bykov et al. 2025; Chakraborty et al. 2021, 2025a; Nicholl et al. 2024; Hernández-García et al. 2025).
The QPE physical origin remains uncertain and is the subject of active research. Models proposed so far cluster in two main categories, namely those that invoke different flavors of disk instabilities (Raj & Nixon 2021; Pan et al. 2022, 2023; Śniegowska et al. 2023; Kaur et al. 2023) and those associated with the interaction between the central SMBH (and/or its disk) and a secondary orbiting companion within an extreme mass-ratio inspiral (EMRI) system. The latter class further divides into models invoking mass transfer at pericenter from the companion star (King 2020, 2022; Zhao et al. 2022; Wang et al. 2022; Krolik & Linial 2022; Linial & Sari 2023; Chen et al. 2023; Lu & Quataert 2023; Olejak et al. 2025) and those that call on collisions between the companion (a star or stellar mass black hole) and the (likely post-TDE or a new accretion flow) accretion disk, in which QPEs result either from the collision itself (Suková et al. 2021; Xian et al. 2021; Franchini et al. 2023; Linial & Metzger 2023; Tagawa & Haiman 2023; Zhou et al. 2024; Vurm et al. 2025) or from shocks due to the impact of a stream of debris ablated from the star at each collision with the disk itself. Which of the latter two effects dominates QPE emission depends on the disk (and stream) properties at the impact site (Yao et al. 2025). Recent studies suggest that debris-disk shocks might indeed represent a preferential channel for QPE emission especially for long-period QPE systems (such as Ansky) where the interaction is likely to occur at large radii and relatively low disk density (Yao et al. 2025; Mummery 2025; Linial et al. 2025). If QPEs are indeed produced by EMRIs interacting with post-TDE disks or experiencing mass transfer episodes, this would imply that QPEs represent the first-observed electromagnetic counterparts to EMRIs, potentially detectable as multi-messenger sources by future millihertz gravitational wave detectors such as LISA (Amaro-Seoane et al. 2023) and TianQin (Luo et al. 2016).
Hernández-García et al. (2025) recently reported the discovery of QPEs in the nucleus of the galaxy SDSS J1335+0728 at a redshift of 0.024 and with an estimated black hole mass of ∼106 M⊙, based on its stellar mass (Reines & Volonteri 2015). This followed an optical transient, named Ansky after its ZTF object ID (ZTF19acnskyy), which is consistent with either a “turning on” active galactic nucleus (AGN) or an unusual nuclear transient (Sánchez-Sáez et al. 2024). The observed QPEs exhibited a peak luminosity of L ∼ 2 × 1043 erg s−1, had a typical duration of ∼1.5 days, and were separated by ∼4.5 days. At Fpeak > 10−11 erg s−1 cm−2, it is 10 times brighter than any known QPE. One remarkable detail of this event was the initial lack of X-ray emission, constrained by eROSITA (2020–2023) and Swift/XRT upper limits (Aug. 2021–Jul. 2023). In 2024, Ansky showed the longest durations and recurrence times of all known QPEs, with the most extreme timing behavior seen yet. Ansky also showed significant X-ray spectral, time-varying emission and/or absorption features changing in centroid, width, and depth over the course of each eruption, which was modeled by Chakraborty et al. (2025b) as a time-evolving P Cygni profile, possibly emerging from the debris ejected by the orbiter-disk collision (Vurm et al. 2025).
Given its brightness, Ansky is an ideal target for continued monitoring to shed light on the evolution of QPEs with time. Over the past year, NICER has observed the source extensively, providing valuable data for tracking these changes. In this work, we report recent (2025) NICER follow-up observations of Ansky, which revealed that its eruption pattern has changed since the last observations obtained in July 2024. Section 2 shows the data used in this work. Section 3 presents the results of the data analysis. In Sect. 4 we discuss potential mechanisms to explain the new observations. Finally, in Sect. 5 we summarize our findings.
2. Observations and data reduction
The NICER X-ray Timing Instrument (Gendreau et al. 2016) observed Ansky for a total of 283 ks across 213 observations from January 7 to June 16, 2025, in addition to the 278 ks across 60 observations from May 19 to July 20, 2024, presented in Hernández-García et al. (2025). No observations were carried out between these dates because the source was behind the Sun. The data were processed using HEAsoft v6.33 and NICERDAS v12. We followed the time-resolved spectroscopy approach for reliably estimating the background-subtracted light curve outlined in Chakraborty et al. (2024); we refer to their Sect. 2.1 for details. The light curve thus generated is presented in Fig. 1. We consider a source “detection” as any good time interval (GTI) in which the addition of a source component is an improvement over the background-only fit by ΔC-stat. ≥ 25 determined empirically as a suitable boundary. All GTIs are 200 seconds. The flux upper limits are in the range (2.3 − 4.1)×10−13 erg s−1 cm−2. The resulting time-resolved blackbody fit parameters were used to build the plots in Sect. 3.
 |
Fig. 1. NICER X-ray light curve of Ansky for the period May 19–July 20, 2024 (upper panel). Detections are plotted as black circles, and non-detections as gray triangles. The typical peak-to-peak timescale is ∼4.5 days; these QPEs were presented in Hernández-García et al. (2025). NICER light curve between January 7 and March 30, 2025 (bottom panel). The typical peak-to-peak timescale is ∼10 days. Note that there are no observations around MJD 60700, so there might be a missing flare. The dashed lines represent exponential rise and decay profiles fit to each QPE (see Sect. 3). The horizontal axis spans an equal number of days in 2024 and 2025 to facilitate timescale comparison. |
3. Results
In Fig. 1 (bottom panel), we present the NICER X-ray data light curve generated by our time-resolved spectroscopy approach outlined in Sect. 2. In total, 14 QPEs were observed between January and June, with recurrence times (peak-to-peak separations) of approximately 10 days, and durations (time spent about ≥0.01 Lpeak) between approximately 2.1 − 3.6 days. Note the gap in observations around MJD 60700, where a flare was possibly missed. These timescales are approximately twice as long as those observed in 2024 and reported in Hernández-García et al. (2025), when flare duration was approximately 1.5 days and peak-to-peak duration was approximately 4.5 days (Fig. 1, top panel).
We used an exponential rise and/or decay model, which is common in the literature for QPEs (Arcodia et al. 2022), to fit the flare profiles. The model has the following form:

where F is the flux of the QPE, A is the flare amplitude, tpeak is the time of peak flux, τ1 and τ2 are the e-folding times of rise and decay, respectively,  is a normalization to join rise and decay, and
  sets the asymptote time such that FQPE = 0 for t < tpeak − tas.
By integrating over the above definition of burst duration, we computed the total energy outputs of the flares, resulting in an average integrated energy output of (3.98 ± 0.4)×1048 erg. This represents an increase by a factor of four with respect to the flares observed in 2024 (Hernández-García et al. 2025), and at least a couple of orders of magnitude higher than the typical QPE energy in other sources (e.g., Miniutti et al. 2023).
Flare profiles are presented for comparison in Fig. 2, for the eruptions in 2024 (already presented in Chakraborty et al. 2025b; left panel) and 2025 (right panel). The flares from 2025 are visibly more energetic than those from 2024, as quantified above. Additionally, the 2025 profiles have a longer duration and exhibit a more asymmetric shape compared to the more symmetric profiles observed in 2024. We quantified the flare rise and decay times from the best-fit model of FQPE, with the rise time being measured as the interval during which the flare brightens from 1/e3, where e is the Euler’s number, of the peak luminosity to the peak itself, while the decay time corresponds to the interval from the peak back down to 1/e3. This threshold was chosen as in Arcodia et al. (2022), but a simpler analysis was performed here.
 |
Fig. 2. Comparison of the flare profiles from 2024 (left panel) to 2025 (right panel). |
For 2024, we obtain a mean rise time of 0.81 ± 0.08 days and a mean decay time of 1.28 ± 0.10 days. In 2025, the rise time is 0.84 ± 0.06 days, while the decay time increases significantly to 2.23 ± 0.15 days. Uncertainties are estimated as the standard deviation of the mean. In both years, the rise time is consistently shorter than the decay time, and while the change in rise time is not statistically significant, the decay time roughly doubles from 2024 to 2025.
Importantly, this change in flare characteristics is not gradual: while the flares of 2024 show a high degree of similarity to each other, the flares of 2025 also exhibit a high degree of similarity within their group. However, when comparing the two years, their shapes differ significantly, indicating a drastic shift in flare behavior within approximately six months. We notice that the shapes are different even when comparing the normalized flares.
When comparing the periodicity of the data, we can estimate a coarse mean rate of change of period between the 2024 and 2025 observing seasons as Ṗ Δ P/Δt ≈ +0.02. Moreover, at least thirteen consecutive flares are seen at regular intervals as opposed to the behavior in 2024, when longer recurrence times appeared after groups of five flares.
In Fig. 3 we show the time between consecutive flares as a function of flare number for the 2025 observations, based on the flare peak times estimated from the exponential fits. Each data point corresponds to the interval between two successive flares, and the associated error bars represent the uncertainties propagated from the timing uncertainties of the peak positions. A linear fit to the recurrence times (shown as a dashed red line) reveals a gradual increase in the flare period throughout the observations. The best-fit slope is approximately 0.1 days per flare, suggesting a slow but systematic lengthening of the recurrence time. The same analysis cannot be done for the data from 2024, but it is worth noting that this corresponds to a Ṗ ≈ +10−2, i.e., of the same order of magnitude as the change observed between the 2024 and the 2025 seasons. Furthermore, it is worth noting that such an increase in recurrence time has not commonly been observed in other QPE sources. Interpreting this trend, as well as the change in period between 2024 and 2025, is beyond the scope of the present study, since the physical mechanism responsible remains unclear.
 |
Fig. 3. Time between consecutive flares as a function of flare number. Error bars reflect uncertainties propagated from the flare peak times. A linear fit (dashed red line) shows a gradual increase in recurrence time, rising by about 0.1 days per flare. |
Figure 4 shows an example of one of the high signal-to-noise, 200 second exposure, NICER spectra. The spectral fit of the data was done using the model tbabs*zbbody with frozen Galactic NH = 2.6 × 1020 cm−2. This results in blackbody temperatures in the range of kT = [33−114] eV and bolometric luminosities, computed from 0.001−100 keV using the clumin model in XSPEC, in the range of Lbol = [0.06 − 4.29]×1043 erg s−1. The residuals show the clear need for an additional component compatible with the P-Cygni profiles reported in Hernández-García et al. (2025) and Chakraborty et al. (2025b).
 |
Fig. 4. Background-subtracted X-ray spectrum from NICER. This is an example of a high-flux spectrum, taken from one 200 second exposure, used to estimate the spectral parameters. The spectrum is fit with a blackbody model. The residuals in the bottom panel show the presence of an additional component, corresponding to the emission and/or absorption feature around ∼1 keV, analyzed in detail in Chakraborty et al. (2025b). |
In the left panel of Fig. 5 we present the bolometric luminosities as a function of temperature, illustrating the “hysteresis” behavior commonly observed in QPEs, where the rise occurs at higher temperatures than the decline. This spectral evolution is often regarded as a hallmark of QPEs, as it appears in all known sources, suggesting a shared physical mechanism underlying their emission. In the right panel of Fig. 5, we show the inferred blackbody radius from the Stefan-Boltzmann law, 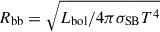 . The emission radius starts at Rbb ∼ R⊙ and grows by a factor of 2−3 over the course of an eruption, as seen in other QPEs (Miniutti et al. 2023; Quintin et al. 2023; Arcodia et al. 2022; Chakraborty et al. 2024; Giustini et al. 2024; Nicholl et al. 2024). This suggests that the emission region expands significantly as the eruption progresses, with the changes in luminosity and temperature reflecting the evolving size of the emitting region. We note that out-of-equilibrium effects in the photon-starved ejecta could cause the measured blackbody radius to misrepresent the ejecta’s physical size (Linial & Metzger 2023; Vurm et al. 2025). In Ansky we also observe this behavior, which is qualitatively consistent with other QPEs.
 |
Fig. 5. Spectral evolution of the QPEs in Ansky for the bursts observed by NICER in 2025. The color scheme indicates the time relative to peak (dark at early times, and light at late times). The QPEs undergo hysteresis in the L − kT plane (left panel), which, for a blackbody-like spectrum, can be interpreted as an expanding emission region Rbb (right panel). The error bars represent ±1σ uncertainties. |
In Fig. 6, we show the burst durations, Tdur, with peak-to-peak recurrence time, Trec, of Ansky in 2024 and 2025, along with those for other QPEs in the literature. We define the flare duration as the interval beginning when the model flux rises above 0.01 Lpeak and ending when it decreases below this threshold. With these flare profiles, we find a mean peak-to-peak recurrence time of trecur = 907 ± 25 ks and mean duration of tdur = 243 ± 35 ks. We recall that these parameters were trecur = 436.8 ± 80.3 ks and a mean duration of tdur = 129 ± 43.2 ks in 2024 (Hernández-García et al. 2025)1. Ansky fits well in the empirical scaling relation of  observed in QPEs (Hernández-García et al. 2025; Chakraborty et al. 2025a). It had the longest timescales in 2024, and as shown the new eruptions further extend this relationship. We caution that this relation remains subject to small-number statistics, and gaps in observational coverage may influence this apparent correlation. The shaded regions represent excluded areas of the parameter space. For instance, sources with Tdur ≥ Trec would not be identifiable as QPEs, as they would lack well-resolved individual bursts, and note that the observational appearance of flares with Tdur ≃ Trec would be that of a quasiperiodic oscillation (QPO) rather than a QPE (Lin et al. 2013; Webbe & Young 2023).
 |
Fig. 6. QPE population-level tdur − trecur relation. Burst duration and recurrence times are shown for known QPEs. Ansky shows an increase in both timescales compared to QPEs in 2024 but closely follows the power-law fit to the observed data points (dashed line; dotted lines represent one standard deviation). The error bars indicate the range of timescales observed for each source, rather than representing measurement uncertainties. |
4. Discussion
The new 2025 observing campaign reveals QPEs that are four times more energetic than in 2024, with an average recurrence time of approximately 10 days and flare durations between 2.5−4 days; in both cases about twice as long as observed in 2024. The extreme variation in both timing and radiated energy, occurring within less than one year, represents a challenge for QPE models, some of which are briefly discussed below.
4.1. EMRI collision models
In the framework of star-disk collisions in an EMRI system, QPEs might be produced via two different mechanisms, namely the star-disk interaction itself or the interaction between the disk and a debris stream that is ablated from the star at each collision. Assuming for simplicity the case in which the debris remains within the Hill sphere, the dominant mechanism for QPE production depends on the relative disk and the debris surface density at the impact site, Σdisk and Σdebris, as discussed in detail by Yao et al. (2025). For Σdebris ≪ Σdisk, the shock between the stream and the disk is inefficient for photon production, and direct star-disk collisions are expected to dominate. On the other hand when Σdebris ≳ Σdisk, shocks from the debris-disk interaction dominate the QPE emission due to the large size of the stream, its low optical depth, and a prolonged interaction time. If Σdebris ≫ Σdisk, the debris stream basically acts as a star, and QPEs are produced in a similar fashion as in direct star-disk collisions, as discussed below (Yao et al. 2025; Linial et al. 2025; Mummery 2025).
The impact of a star with the disk results in a radiation-mediated shock in which a portion of the shocked disk material is expelled from the midplane in a two-sided fountain that expands due to radiation pressure. The QPEs are then generated by the photons emerging from the inner photosphere embedded in the expanding ejecta (Linial & Metzger 2023; Vurm et al. 2025; Chakraborty et al. 2025b). Given the presence of the two-sided ejecta with similar properties, one would therefore expects to observe two QPEs per orbit. Moreover, the photons escaping from the inner photosphere must pass through the surrounding expanding ejecta, which could imprint spectral features associated with outflowing material. Such P-Cygni profiles, evolving in strength and velocity during the single QPE, were indeed detected during the 2024 campaign in the QPE X-ray spectra of Ansky, which provides some support for the overall star-disk collision model from 2024, or at least for the QPE emission mechanism in terms of expanding ejecta (Chakraborty et al. 2025b).
Such a model, however, fails to explain the sudden change in timing properties as well as energetics from the 2024 and the 2025 campaign. The doubling of recurrence times would imply that the secondary has moved outward significantly, which seems unfeasible even when considering possible interactions with third bodies. Moreover, the star would impact less dense disk material, likely leading to less – rather than more – energetic bursts. A plausible solution would be that the EMRI orbit remains the same, even though we now observe only one QPE per orbit instead of two, which is also consistent with the almost precise doubling of recurrence times. This might occur because of geometrical effects in which one collision is missed (a warped, precessing, or elliptical disk, for example). Orbital eccentricity might also result in missed collisions depending on the apsidal phase, but the regularity of the recurrence times in both 2024 and 2025 suggests that the orbital eccentricity of Ansky is nearly zero.
On the other hand, Yao et al. (2025), Mummery (2025), and Linial et al. (2025) suggest that, within the EMRI collision scenario, QPEs might be dominated by impacts between the debris stream ablated from the star at each star-disk collision rather than by the star-disk interaction itself. Debris-disk collisions are in fact expected to be more efficient than star-disk ones, especially for sources with long recurrence times (≳1 day) and duration, and with large radiated energy, as is the case for Ansky. Moreover, debris-disk interactions account in a more natural way for some of the observed QPE properties (e.g., the correlation between duration and recurrence; see Fig. 6 of Linial et al. 2025, among others). Within this context and if the stream does not have enough inertia to penetrate the disk, the debris-disk impact is expected to produce only one QPE per orbit, since the emission from the resulting shock is blocked on one side by the optically thick disk. However, streams – whose density contrast with the disk is higher – might penetrate the disk and give rise to two-sided ejecta similar to those that originate from direct star-disk collisions, thereby producing two QPEs per orbit (Yao et al. 2025).
A possible qualitative picture therefore emerges: in 2024, the debris penetrate the disk, giving rise to two-sided ejecta that dominate the X-ray emission, as in the case of star-disk collisions, and producing two QPEs per orbit. This might be, for example, because of a high disk scale-height or low density at the impact site during the early stages of the post-transient events, or to the coupled evolution of the star-disk system, leading to rapid changes in the disk structure (as discussed by Linial & Metzger 2024). As the disk structure evolves with time, and likely that of debris streams with the number of collisions, the density contrast between the debris and the disk is reduced in 2025. As a result, the stream no longer penetrates the disk, shock emission is confined to only one side of the disk midplane, and only one QPE per orbit is visible, resulting in the observed doubling of recurrence times. A more tenuous debris stream in 2025 is also likely larger than in 2024, which could explain the longer duration and higher luminosity of QPEs. However, it is not immediately clear that a reduction in stream density, even if coupled with a larger extent, can increase the eruption energy by a factor of four as observed, and this is a worthy avenue for further investigation.
The picture outlined above is only qualitative but could be tested more quantitatively through simulations of star ablation as well as disk structure evolution. We must, however, point out that the disk in Ansky might not be a pure post-TDE one if an AGN disk was already present, which may introduce further complexity (Sánchez-Sáez et al. 2024; Hernández-García et al. 2025). If the picture we suggest is correct, then the recurrence time of Ansky’s QPEs should stabilize within approximately 10 days in the near future, although rapid switching between approximately 5 and 10 days cannot be excluded (Linial & Metzger 2024). The detection of doubling recurrence times in other QPE sources with long recurrence in the future may provide strong evidence for the proposed scenario.
4.2. Alternative scenarios: Mass transfer and disk instabilities
Quasi-periodic eruptions have also been associated with mass transfer scenarios from a white dwarf in a highly eccentric orbit (e.g., King 2020, 2022; Wang et al. 2022), or from stars (main sequence or evolved) on more circular orbits (see, for example, Zhao et al. 2022; Lu & Quataert 2023; Olejak et al. 2025; D’Orazio et al. 2025), with the emission generally attributed to accretion onto the SMBH, perhaps mediated by the existing disk. In all cases, however, mass transfer occurs at pericenter, and pericenter passages act as a rather stable clock that is unlikely to experience large variations. The alternating longer and shorter recurrence times that are typical of GSN 069, eRO-QPE2, RX J1301.9+2747, and other sources are problematic within that context. While it has been argued that stable mass transfer could explain these features (King 2022) and more recent studies extending these models are able to reproduce the year-long disappearance of flares (Yang et al. 2025), the mechanism by which such stability produces a variable recurrence time remains debated (e.g., Linial & Sari 2023); and the system evolution may likely end with the complete disruption of the star.
Moreover, QPEs are typically observed after a TDE, not before, complicating the viability of preexisting binary mass transfer as the trigger. For main-sequence donors, Ryu et al. (2020) suggested that repeated tidal interactions could cause stochastic energy exchange, potentially explaining a positive Ṗ as seen in Ansky. However, the magnitude of the observed period change would require substantial mass loss, likely altering the stellar structure to an extent incompatible with continued QPE production (Linial & Quataert 2024).
An alternative hybrid scenario may involve interaction between a pericenter mass stream and a remnant post-TDE disk, resembling a debris–disk or stream–stream collision model (e.g., Krolik & Linial 2022). In such a case, variability in the recurrence time could emerge from dynamical changes in the disk rather than the orbit itself. Still, this would require detailed modeling to assess whether the observed properties of Ansky and similar systems can be consistently reproduced.
Accretion disk instability models do not suffer from the strict timing requirements set by an orbiter and may thus be able to explain changes in recurrence time at different epochs. As the disk evolves, the radial location and extent of the unstable region is bound to change, leading to different characteristic timescales. Classical radiation pressure instabilities are associated with timescales that are much too long in SMBH disks to account for the observed QPEs. However, the presence of large-scale magnetic fields can shrink the unstable region to sufficiently small sizes and radii for a given range of black hole mass and accretion rate that the typical hours to days recurrence timescales of QPEs can be reproduced (Pan et al. 2022, 2023; Śniegowska et al. 2023; Kaur et al. 2023). Moreover, the spectral evolution during QPEs can also be accounted for as shown, for example, by Pan et al. (2023). A recent extension of this framework identifies critical thresholds in accretion rate and magnetic field parameters that separate stable and unstable QPE regimes, naturally explaining both regular and stochastic eruption patterns while maintaining consistent peak temperatures (Pan et al. 2025).
The profile of the single burst is also different from that of the observed QPEs. While the QPE rise overall is significantly faster than its decay, bursts associated with radiation-pressure instability are characterized by slow rises during the interval between the bursts that culminate at peak and are subsequently followed by very fast decays; see, e.g., the typical profile of heartbeats in GRS 1915+105 (Neilsen et al. 2011) or the profiles from the simulated light curves of QPEs (Figs. 2, 5, and 6 in Pan et al. 2023 for instance); however, this is not observed in any of the QPE sources. Other instabilities, such as the thermal-viscous instability, can produce fast rises and slow decays, as seen for example in X-ray binary outbursts (Remillard & McClintock 2006). However, these instabilities are associated with much longer timescales in SMBH disks and do not seem capable of producing recurrence times as short as a few hours, as observed in some QPEs, even when considering magnetically supported disks (Hameury et al. 2009; Noda & Done 2018). Meanwhile, disk tearing instabilities still need to be applied more quantitatively to QPEs (Raj & Nixon 2021). In summary, the radiation-pressure instability in modified, magnetized disks appears to be a promising alternative mechanism for QPE production that could potentially explain the observed changes in QPE timescales of Ansky; thus it should be explored further together with EMRI-based models.
5. Summary
In this manuscript, we report NICER observations of the QPEs in Ansky, taken between January and June 2025. The new observing campaign reveals QPEs that are four times more energetic than in 2024, with a peak-to-peak recurrence time of approximately 10 days, and flare durations between 2.5−4 days. These time scales are approximately two times longer than those observed between May and July 2024. We estimate the mean rate of change of period between both observing seasons as Ṗ ≈ +0.02. Interestingly, the interval between the consecutive flares increases at a rate of approximately 0.1 days per flare in 2025, with a Ṗ ≈ +10−2. The flares have also changed their profiles: they presently show more asymmetry than in 2024, and while the rise times remain similar in both years, the decay times in 2025 are roughly twice as long as those observed in 2024.
We discuss potential mechanisms that may explain these new observed timescales. We propose a qualitative scenario in which the QPEs in Ansky originate from interactions between a stellar companion and a post-TDE accretion disk, or a newly formed accretion flow in an EMRI system. Specifically, we suggest that the dominant emission mechanism evolved from two-sided shocks caused by debris streams penetrating the disk in 2024 (producing two QPEs per orbit) to one-sided shocks in 2025, as a result of changing disk and stream properties that reduced the stream’s ability to cross the disk. This transition naturally explains the observed doubling of recurrence times as well as the longer duration and higher luminosity of QPEs in 2025.
Although this picture provides a coherent explanation for the temporal and spectral evolution of the QPEs in Ansky, it remains qualitative and requires confirmation through future numerical simulations. We also caution that the presence of a preexisting AGN disk could introduce additional complexity.
Importantly, we do not rule out alternative models. In particular, mass transfer scenarios could still be relevant if the transferred material interacts with the disk rather than accreting directly onto the SMBH, producing similar effects to those expected from stream-disk collisions. Similarly, disk instability models, especially those involving magnetically supported radiation-pressure instabilities, remain promising alternatives, as they naturally accommodate variability in recurrence times without requiring orbital modulation. However, such models face challenges in reproducing key features of the QPE flare profiles, such as their rapid rise and slower decay.
Further monitoring is required to fully understand the nature and evolution of the QPEs in Ansky. Its high brightness makes it an ideal source for studying the mechanisms driving QPEs, and the ongoing, approved monitoring with NICER and XMM-Newton will provide valuable data to track the continued evolution of the period. These observations will be key to constraining physical models that can explain Ansky’s peculiar behavior.
Note that this estimation includes the longer gaps.
Acknowledgments
We thank the referee for constructive feedback that helped improving the manuscript. The authors are grateful to the participants of the X-ray Quasi-Periodic Eruptions & Repeating Nuclear Transients conference (16–19 June 2025, ESAC, Madrid) for valuable discussions. We acknowledge funding from ANID programs: Millennium Science Initiative Program NCN2023_002 (LHG, JCu, PA, PL), Millennium Science Initiative, AIM23-0001 (LHG, PA), FONDECYT Iniciación 11241477 (LHG), FONDECYT Regular 1251444 (JCu), 1241422, 1241005 (PA), 1230345 (CR), ANID BASAL project FB210003 and the China-Chile joint research fund (CR), and CAV, CIDI N. 21 U.de Valparaíso, Chile (PA). GM acknowledges funding from the Spanish MICIU/AEI/10.13039/501100011033 and ERDF/EU grants PID2020-115325GB-C31 and PID2023-147338NB-C21. RA was supported by NASA through the NASA Hubble Fellowship grant #HST-HF2-51499.001-A awarded by the Space Telescope Science Institute, which is operated by the Association of Universities for Research in Astronomy, Incorporated, under NASA contract NAS5-26555. JC’s research was partially supported by the Munich Institute for Astro-, Particle and BioPhysics (MIAPbP) which is funded by the Deutsche Forschungsgemeinschaft (DFG, German Research Foundation) under Germany’s Excellence Strategy – EXC-2094 – 390783311. MG is funded by Spanish MICIU/AEI/10.13039/501100011033 and ERDF/EU grant PID2023-147338NB-C21.
References
- Amaro-Seoane, P., Andrews, J., Arca Sedda, M., et al. 2023, Liv. Rev. Relat., 26, 2 [NASA ADS] [CrossRef] [Google Scholar]
- Arcodia, R., Merloni, A., Nandra, K., et al. 2021, Nature, 592, 704 [NASA ADS] [CrossRef] [Google Scholar]
- Arcodia, R., Miniutti, G., Ponti, G., et al. 2022, A&A, 662, A49 [NASA ADS] [CrossRef] [EDP Sciences] [Google Scholar]
- Arcodia, R., Liu, Z., Merloni, A., et al. 2024a, A&A, 684, A64 [NASA ADS] [CrossRef] [EDP Sciences] [Google Scholar]
- Arcodia, R., Linial, I., Miniutti, G., et al. 2024b, A&A, 690, A80 [NASA ADS] [CrossRef] [EDP Sciences] [Google Scholar]
- Arcodia, R., Baldini, P., Merloni, A., et al. 2025, ApJ, 989, 13 [Google Scholar]
- Bykov, S. D., Gilfanov, M. R., Sunyaev, R. A., & Medvedev, P. S. 2025, MNRAS, 540, 30 [Google Scholar]
- Chakraborty, J., Kara, E., Masterson, M., et al. 2021, ApJ, 921, L40 [NASA ADS] [CrossRef] [Google Scholar]
- Chakraborty, J., Arcodia, R., Kara, E., et al. 2024, ApJ, 965, 12 [CrossRef] [Google Scholar]
- Chakraborty, J., Kara, E., Arcodia, R., et al. 2025a, ApJ, 983, L39 [Google Scholar]
- Chakraborty, J., Kosec, P., Kara, E., et al. 2025b, ApJ, 984, 124 [Google Scholar]
- Chen, J.-H., Shen, R.-F., & Liu, S.-F. 2023, ApJ, 947, 32 [NASA ADS] [CrossRef] [Google Scholar]
- D’Orazio, D. J., Tiede, C., Zwick, L., Hayasaki, K., & Mayer, L. 2025, ArXiv e-prints [arXiv:2501.10509] [Google Scholar]
- Franchini, A., Bonetti, M., Lupi, A., et al. 2023, A&A, 675, A100 [NASA ADS] [CrossRef] [EDP Sciences] [Google Scholar]
- Gendreau, K. C., Arzoumanian, Z., Adkins, P. W., et al. 2016, Proc. SPIE, 9905, 99051H [NASA ADS] [CrossRef] [Google Scholar]
- Giustini, M., Miniutti, G., & Saxton, R. D. 2020, A&A, 636, L2 [NASA ADS] [CrossRef] [EDP Sciences] [Google Scholar]
- Giustini, M., Miniutti, G., Arcodia, R., et al. 2024, A&A, 692, A15 [NASA ADS] [CrossRef] [EDP Sciences] [Google Scholar]
- Guolo, M., Mummery, A., Ingram, A., et al. 2025, ApJ, 992, 114 [Google Scholar]
- Hameury, J. M., Viallet, M., & Lasota, J. P. 2009, A&A, 496, 413 [NASA ADS] [CrossRef] [EDP Sciences] [Google Scholar]
- Hernández-García, L., Chakraborty, J., Sánchez-Sáez, P., et al. 2025, Nat. Astron., 9, 895 [Google Scholar]
- Kaur, K., Stone, N. C., & Gilbaum, S. 2023, MNRAS, 524, 1269 [NASA ADS] [CrossRef] [Google Scholar]
- King, A. 2020, MNRAS, 493, L120 [Google Scholar]
- King, A. 2022, MNRAS, 515, 4344 [NASA ADS] [CrossRef] [Google Scholar]
- Krolik, J. H., & Linial, I. 2022, ApJ, 941, 24 [NASA ADS] [CrossRef] [Google Scholar]
- Lin, D., Irwin, J. A., Godet, O., Webb, N. A., & Barret, D. 2013, ApJ, 776, L10 [NASA ADS] [CrossRef] [Google Scholar]
- Linial, I., & Metzger, B. D. 2023, ApJ, 957, 34 [NASA ADS] [CrossRef] [Google Scholar]
- Linial, I., & Metzger, B. D. 2024, ApJ, 973, 101 [Google Scholar]
- Linial, I., & Quataert, E. 2024, MNRAS, 527, 4317 [Google Scholar]
- Linial, I., & Sari, R. 2023, ApJ, 945, 86 [NASA ADS] [CrossRef] [Google Scholar]
- Linial, I., Metzger, B. D., & Quataert, E. 2025, ApJ, 991, 147 [Google Scholar]
- Lu, W., & Quataert, E. 2023, MNRAS, 524, 6247 [NASA ADS] [CrossRef] [Google Scholar]
- Luo, J., Chen, L.-S., Duan, H.-Z., et al. 2016, Class. Quant. Grav., 33, 035010 [NASA ADS] [CrossRef] [Google Scholar]
- Miniutti, G., Saxton, R. D., Giustini, M., et al. 2019, Nature, 573, 381 [Google Scholar]
- Miniutti, G., Giustini, M., Arcodia, R., et al. 2023, A&A, 670, A93 [NASA ADS] [CrossRef] [EDP Sciences] [Google Scholar]
- Mummery, A. 2025, ArXiv e-prints [arXiv:2504.21456] [Google Scholar]
- Neilsen, J., Remillard, R. A., & Lee, J. C. 2011, ApJ, 737, 69 [Google Scholar]
- Nicholl, M., Pasham, D. R., Mummery, A., et al. 2024, Nature, 634, 804 [CrossRef] [Google Scholar]
- Noda, H., & Done, C. 2018, MNRAS, 480, 3898 [Google Scholar]
- Olejak, A., Stegmann, J., de Mink, S. E., et al. 2025, ApJ, 987, L11 [Google Scholar]
- Pan, X., Li, S.-L., Cao, X., Miniutti, G., & Gu, M. 2022, ApJ, 928, L18 [NASA ADS] [CrossRef] [Google Scholar]
- Pan, X., Li, S.-L., & Cao, X. 2023, ApJ, 952, 32 [CrossRef] [Google Scholar]
- Pan, X., Li, S.-L., Cao, X., Liu, B., & Yuan, W. 2025, ApJ, 989, 196 [Google Scholar]
- Quintin, E., Webb, N. A., Guillot, S., et al. 2023, A&A, 675, A152 [NASA ADS] [CrossRef] [EDP Sciences] [Google Scholar]
- Raj, A., & Nixon, C. J. 2021, ApJ, 909, 82 [NASA ADS] [CrossRef] [Google Scholar]
- Reines, A. E., & Volonteri, M. 2015, ApJ, 813, 82 [NASA ADS] [CrossRef] [Google Scholar]
- Remillard, R. A., & McClintock, J. E. 2006, ARA&A, 44, 49 [Google Scholar]
- Ryu, T., Krolik, J., Piran, T., & Noble, S. C. 2020, ApJ, 904, 100 [NASA ADS] [CrossRef] [Google Scholar]
- Sánchez-Sáez, P., Hernández-García, L., Bernal, S., et al. 2024, A&A, 688, A157 [NASA ADS] [CrossRef] [EDP Sciences] [Google Scholar]
- Śniegowska, M., Grzȩdzielski, M., Czerny, B., & Janiuk, A. 2023, A&A, 672, A19 [NASA ADS] [CrossRef] [EDP Sciences] [Google Scholar]
- Suková, P., Zajaček, M., Witzany, V., & Karas, V. 2021, ApJ, 917, 43 [CrossRef] [Google Scholar]
- Tagawa, H., & Haiman, Z. 2023, MNRAS, 526, 69 [NASA ADS] [CrossRef] [Google Scholar]
- Vurm, I., Linial, I., & Metzger, B. D. 2025, ApJ, 983, 40 [Google Scholar]
- Wang, M., Yin, J., Ma, Y., & Wu, Q. 2022, ApJ, 933, 225 [NASA ADS] [CrossRef] [Google Scholar]
- Webbe, R., & Young, A. J. 2023, MNRAS, 518, 3428 [Google Scholar]
- Wevers, T., Guolo, M., Lockwood, S., et al. 2025, ApJ, 980, L1 [Google Scholar]
- Xian, J., Zhang, F., Dou, L., He, J., & Shu, X. 2021, ApJ, 921, L32 [NASA ADS] [CrossRef] [Google Scholar]
- Yang, Y., Yang, J., Chen, X., & Zhang, Z.-H. 2025, MNRAS, 543, 3503 [Google Scholar]
- Yao, P. Z., Quataert, E., Jiang, Y.-F., Lu, W., & White, C. J. 2025, ApJ, 978, 91 [Google Scholar]
- Zhao, Z. Y., Wang, Y. Y., Zou, Y. C., Wang, F. Y., & Dai, Z. G. 2022, A&A, 661, A55 [NASA ADS] [CrossRef] [EDP Sciences] [Google Scholar]
- Zhou, C., Huang, L., Guo, K., Li, Y.-P., & Pan, Z. 2024, Phys. Rev. D, 109, 103031 [NASA ADS] [CrossRef] [Google Scholar]
All Figures
|
Fig. 1. NICER X-ray light curve of Ansky for the period May 19–July 20, 2024 (upper panel). Detections are plotted as black circles, and non-detections as gray triangles. The typical peak-to-peak timescale is ∼4.5 days; these QPEs were presented in Hernández-García et al. (2025). NICER light curve between January 7 and March 30, 2025 (bottom panel). The typical peak-to-peak timescale is ∼10 days. Note that there are no observations around MJD 60700, so there might be a missing flare. The dashed lines represent exponential rise and decay profiles fit to each QPE (see Sect. 3). The horizontal axis spans an equal number of days in 2024 and 2025 to facilitate timescale comparison. |
| In the text | |
|
Fig. 2. Comparison of the flare profiles from 2024 (left panel) to 2025 (right panel). |
| In the text | |
|
Fig. 3. Time between consecutive flares as a function of flare number. Error bars reflect uncertainties propagated from the flare peak times. A linear fit (dashed red line) shows a gradual increase in recurrence time, rising by about 0.1 days per flare. |
| In the text | |
|
Fig. 4. Background-subtracted X-ray spectrum from NICER. This is an example of a high-flux spectrum, taken from one 200 second exposure, used to estimate the spectral parameters. The spectrum is fit with a blackbody model. The residuals in the bottom panel show the presence of an additional component, corresponding to the emission and/or absorption feature around ∼1 keV, analyzed in detail in Chakraborty et al. (2025b). |
| In the text | |
|
Fig. 5. Spectral evolution of the QPEs in Ansky for the bursts observed by NICER in 2025. The color scheme indicates the time relative to peak (dark at early times, and light at late times). The QPEs undergo hysteresis in the L − kT plane (left panel), which, for a blackbody-like spectrum, can be interpreted as an expanding emission region Rbb (right panel). The error bars represent ±1σ uncertainties. |
| In the text | |
|
Fig. 6. QPE population-level tdur − trecur relation. Burst duration and recurrence times are shown for known QPEs. Ansky shows an increase in both timescales compared to QPEs in 2024 but closely follows the power-law fit to the observed data points (dashed line; dotted lines represent one standard deviation). The error bars indicate the range of timescales observed for each source, rather than representing measurement uncertainties. |
| In the text | |
Current usage metrics show cumulative count of Article Views (full-text article views including HTML views, PDF and ePub downloads, according to the available data) and Abstracts Views on Vision4Press platform.
Data correspond to usage on the plateform after 2015. The current usage metrics is available 48-96 hours after online publication and is updated daily on week days.
Initial download of the metrics may take a while.