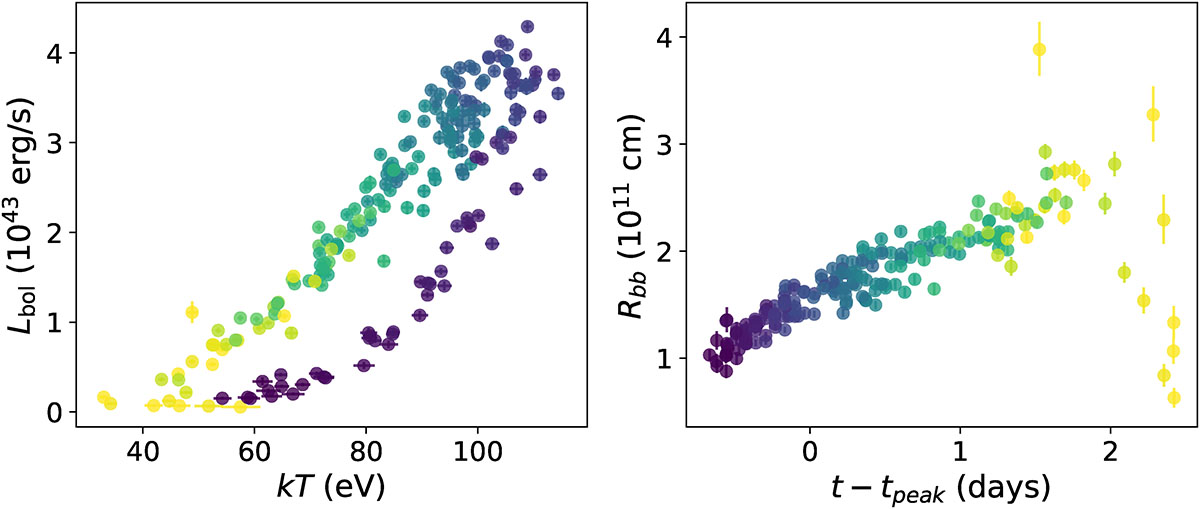
Fig. 5.
Download original image
Spectral evolution of the QPEs in Ansky for the bursts observed by NICER in 2025. The color scheme indicates the time relative to peak (dark at early times, and light at late times). The QPEs undergo hysteresis in the L − kT plane (left panel), which, for a blackbody-like spectrum, can be interpreted as an expanding emission region Rbb (right panel). The error bars represent ±1σ uncertainties.
Current usage metrics show cumulative count of Article Views (full-text article views including HTML views, PDF and ePub downloads, according to the available data) and Abstracts Views on Vision4Press platform.
Data correspond to usage on the plateform after 2015. The current usage metrics is available 48-96 hours after online publication and is updated daily on week days.
Initial download of the metrics may take a while.