Fig. 1.
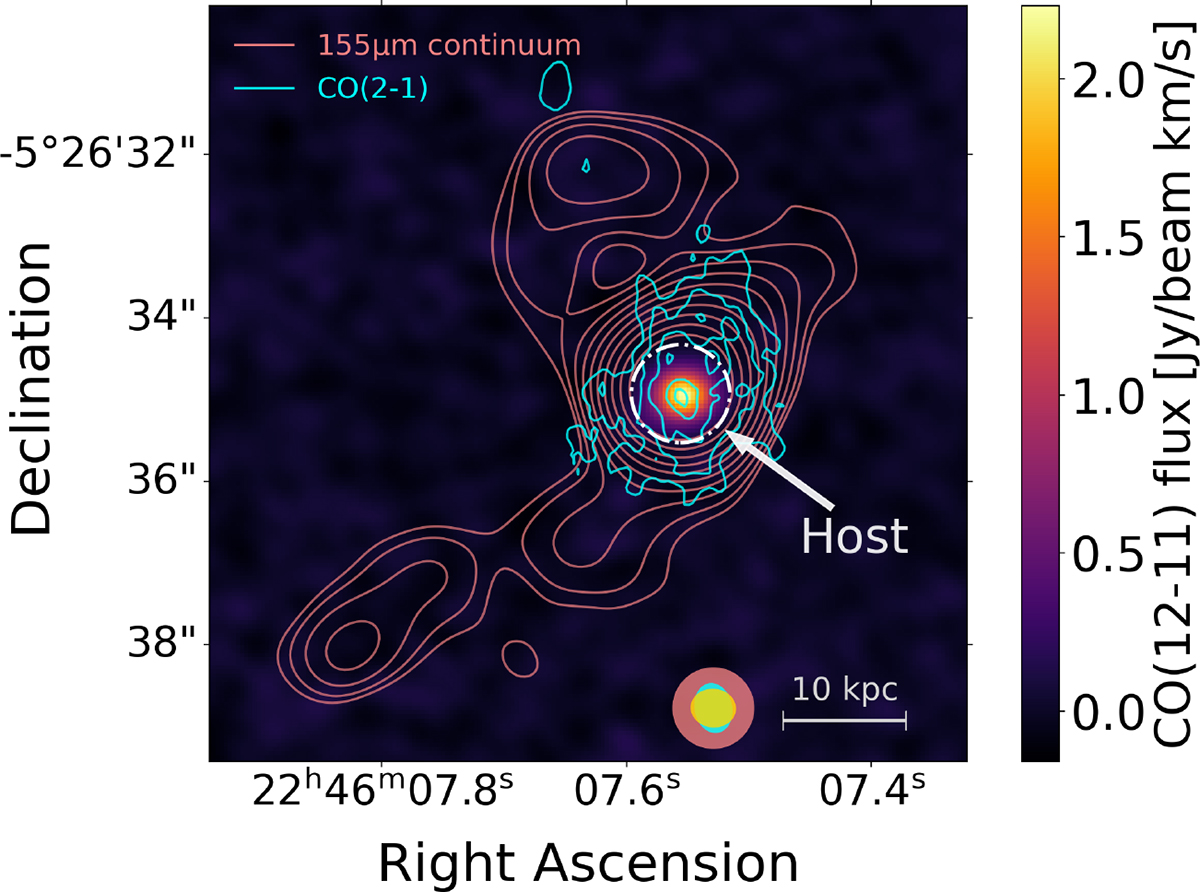
Download original image
Velocity-integrated CO(12–11) line emission from the central region of W2246–0526 (host), the extended dust continuum emission at rest-frame 155 μm from Fernández Aranda et al. (2025) (pink contours), and the VLA B and D configuration CO(2–1) emission (cyan contours). The physical scale is shown in the lower right corner, with the corresponding synthesised beams (pink: dust continuum; cyan: CO(2–1); gold: CO(12–11)). The dash-dotted white circle indicates the r = 0.6″aperture used to extract the flux density measurements of the host; i.e. not including any of the extended emission. Contours reflect [4,5,6,...] × r.m.s) for CO(2–1), and [3, 2(n/2)] × r.m.s. (with n = 4,5,6,...) for the continuum.
Current usage metrics show cumulative count of Article Views (full-text article views including HTML views, PDF and ePub downloads, according to the available data) and Abstracts Views on Vision4Press platform.
Data correspond to usage on the plateform after 2015. The current usage metrics is available 48-96 hours after online publication and is updated daily on week days.
Initial download of the metrics may take a while.