| Issue |
A&A
Volume 703, November 2025
|
|
|---|---|---|
| Article Number | A216 | |
| Number of page(s) | 9 | |
| Section | Extragalactic astronomy | |
| DOI | https://doi.org/10.1051/0004-6361/202555261 | |
| Published online | 26 November 2025 | |
Hot Diggity Dog: Simultaneous CO and dust modelling of the most luminous WISE hot dust-obscured galaxy unveils extreme molecular gas excitation
1
Joint ALMA Observatory, Alonso de Córdova 3107, Vitacura, Santiago RM, Chile
2
National Astronomical Observatory of Japan, Los Abedules 3085 Oficina 701, Vitacura, 763 0414 Santiago, Chile
3
European Southern Observatory, Alonso de Córdova 3107, Vitacura, Casilla, 19001 Santiago RM, Chile
4
Instituto de Estudios Astrofísicos, Facultad de Ingeniería y Ciencias, Universidad Diego Portales, Av. Ejército Libertador 441, Santiago, Chile
5
Department of Physics, University of Crete, 70013 Heraklion, Greece
6
Institute of Astrophysics, Foundation for Research and Technology–Hellas (FORTH), Heraklion 70013, Greece
7
Leiden Observatory, Leiden University, PO Box 9513 NL-2300 RA, Leiden, The Netherlands
8
Max-Planck-Institut für Radioastronomie, Auf dem Hügel 69, 53121 Bonn, Germany
9
School of Sciences, European University Cyprus, Diogenes Street, Engomi, 1516 Nicosia, Cyprus
10
Millenium Nucleus for Galaxies (MINGAL), Av. Ejército Libertador 441, Santiago, Chile
11
National Astronomical Observatories, Chinese Academy of Sciences, 20A Datun Road, Beijing 100101, China
12
Institute for Frontiers in Astronomy and Astrophysics, Beijing Normal University, Beijing 102206, China
13
School of Astronomy and Space Science, University of Chinese Academy of Sciences, Beijing 100049, China
14
Jet Propulsion Laboratory, California Institute of Technology, 4800 Oak Grove Drive, Pasadena, 91109 CA, USA
⋆ Corresponding author: This email address is being protected from spambots. You need JavaScript enabled to view it.
Received:
22
April
2025
Accepted:
25
September
2025
Abstract
Hot dust-obscured galaxies (Hot DOGs), the most infrared (IR) luminous objects selected by the WISE all-sky mid-IR survey, have yielded a sample of intrinsically luminous quasars (QSOs) with obscured nuclear activity and hot dust temperatures. The molecular gas excitation properties have yet to be examined in detail under such extreme conditions. Here we study the most far-IR luminous WISE Hot DOG W2246–0526, focusing on ALMA observations of the central host galaxy. Multi-J CO transition measurements at J = 2 − 1, 5–4, 7–6, 12–11, and 17–16 provide the first self-consistent modelling constraints on the molecular gas and dust properties of any WISE Hot DOG to date, providing a benchmark for future studies of dust-obscured QSOs. We implement a state-of-the-art TUrbulent Non-Equilibrium Radiative transfer model (TUNER) that simultaneously models both the line and dust continuum measurements. Due to a combination of high molecular gas densities and high gas kinetic temperatures, this extreme CO spectral line energy distribution seems to turnover around the CO(12–11) transition, likely making this among the most highly excited galaxies ever reported. The model infers a molecular gas mass ∼8 × 10¹⁰ M⊙, and we conclude that J ≥ 3 CO line luminosities trace the bulk of the molecular gas mass for this extreme system unlike low-excitation conditions calibrated locally. W2246–0526 is a rapidly evolving system, with a high mean value of the molecular gas kinetic temperature versus dust temperature Tk/Td ∼ 4.3. This may be due to the shocks and outflows injecting kinetic energy within the central kiloparsec of this host that have previously been reported. These signs of highly excited molecular gas in W2246–0526 motivates obtaining well-sampled CO ladders in larger samples to better understand the conditions within these short-lived episodes associated with the most obscured supermassive black hole activity.
Key words: techniques: spectroscopic / ISM: molecules / galaxies: high-redshift / galaxies: ISM / quasars: general
© The Authors 2025
 Open Access article, published by EDP Sciences, under the terms of the Creative Commons Attribution License (https://creativecommons.org/licenses/by/4.0), which permits unrestricted use, distribution, and reproduction in any medium, provided the original work is properly cited.
This article is published in open access under the Subscribe to Open model. This email address is being protected from spambots. You need JavaScript enabled to view it. to support open access publication.
1. Introduction
Hot dust-obscured galaxies (Hot DOGs) are extremely luminous unlensed obscured quasars (QSOs) originally detected by the Wide-field Infrared (IR) Survey Explorer (WISE; Wright et al. 2010). The most luminous Hot DOG, WISE J224607.6–052634.9 (W2246–0526 hereafter), is located at z = 4.601 (Díaz-Santos et al. 2021), and is the most luminous obscured galaxy currently known (Tsai et al. 2015). This Hot DOG and its environment have been studied intensively over the past decade (Zewdie et al. 2023, 2025). Powerful active galactic nuclei (AGNs) often reflect intense activity by the central supermassive black hole (SMBH), and this Hot DOG consists of a dust-obscured SMBH that is driving outflows (> 10 000 km s−1), shocks, and intense ionisation and turbulence from its immediate vicinity to the outskirts of the host galaxy (Tsai et al. 2018; Díaz-Santos et al. 2016, 2018; Vayner et al. 2025; Liao et al. 2025). The interstellar medium (ISM) of the host galaxy are characterised through far-IR fine-structure lines observed with the Atacama Large Millimeter Array (ALMA) (Fernández Aranda et al. 2024); however, a detailed investigation into the molecular gas excitation properties is still lacking. A common approach to characterizing the cold-to-warm molecular gas in galaxies is using CO observations in combination with non-local thermodynamic equilibrium (LTE), large velocity gradient (LVG) models (e.g. van der Tak et al. 2007; Weiß et al. 2007), typically assuming a single or double component model with uniform density and temperature. Additional techniques are built upon this approach by simultaneously using CO emission lines and continuum measurements from the rest-frame far-IR, including a turbulence-driven lognormal gas density distribution (Strandet et al. 2017; Boogaard et al. 2020; Harrington et al. 2021; Jarugula et al. 2021). Here we apply such modelling to W2246–0526. Since the discovery of WISE-selected Hot DOGs (Eisenhardt et al. 2012; Wu et al. 2012), some CO analyses exist that examine kinematic properties (Penney et al. 2020; Sun et al. 2024; Martin et al. 2024). There are no a modelling analyses of the rise and fall of the CO ladder in any of the Hot DOGS to constrain the physical molecular gas and dust properties of these heavily dust-obscured systems.
The purpose of this work is twofold: a.) determine the far-IR properties via modelling of the CO and dust emission from the central host of the most well-studied Hot DOG, W2246–0526 while b.) demonstrating insights gained from applying the state-of-the-art turbulent non-local thermodynamic equilibrium (LTE) radiative transfer modelling to such extreme objects. We present both novel and archival ALMA and Very Large Array (VLA) measurements in Sect. 2, our modelling results and discussion are presented in Sect. 3, with a summary in Sect. 4 that provides an outlook for future work to examine the rise and fall of the CO line emission and dust spectral energy distributions (SEDs) in such extreme systems. We adopt a ΛCDM cosmology: H0 = 70 km s−1 Mpc−1, Ωm = 0.3, and ΩΛ = 0.7. This corresponds to 6.536 kpc/″ at the source redshift, z = 4.601.
2. VLA CO(2–1) and ALMA band 3–10 measurements
Here we present new measurements of the CO(12–11) and CO(17–16) emission lines observed with ALMA. The CO(17–16) line is only partially detected (see Appendix A), yet in the modelling we included a conservative 100% uncertainty in the extrapolated estimate for the total line flux as this line may also contain emission from OH+ (Gallerani et al. 2014). We also included previously reported CO(5–4) and CO(7–6) (Martin et al. 2024; Fernández Aranda et al. 2024). We used CO(2–1) line measurements from the VLA, combining the B and D configurations (programme ID: VLA/15B-192;VLA/17B-312) – the D configuration data was first presented in Díaz-Santos et al. (2018). We followed the methodology of Fernández Aranda et al. (2024, 2025), which had performed a resolved dust SED analyses. We extracted the line and continuum emission from the central host (dot-dashed white circle, Figure 1), which has been separated with respect to the known companion galaxies in dust continuum maps (see also Fig. 1 of Fernández Aranda et al. 2025). The CO(2–1) line emission extends beyond the host galaxy, although at a lower signal-to-noise ratio (SNR). Tsai et al. (2018) derived a bolometric luminosity of W2246–0526 to be ∼4 × 10¹⁴ L⊙ with up to ∼2 × 10¹⁴ L⊙ from both the mid-IR and the far-IR energy ranges.
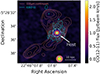 |
Fig. 1. Velocity-integrated CO(12–11) line emission from the central region of W2246–0526 (host), the extended dust continuum emission at rest-frame 155 μm from Fernández Aranda et al. (2025) (pink contours), and the VLA B and D configuration CO(2–1) emission (cyan contours). The physical scale is shown in the lower right corner, with the corresponding synthesised beams (pink: dust continuum; cyan: CO(2–1); gold: CO(12–11)). The dash-dotted white circle indicates the r = 0.6″aperture used to extract the flux density measurements of the host; i.e. not including any of the extended emission. Contours reflect [4,5,6,...] × r.m.s) for CO(2–1), and [3, 2(n/2)] × r.m.s. (with n = 4,5,6,...) for the continuum. |
The purpose of this work is to focus on the joint analyses of the dust emission and CO excitation from the central region of this dust-obscured QSO host, as defined in Fig. 1 and Fernández Aranda et al. (2025). The higher-J CO line measurements have a heterogenous mix of integration times (non-uniform sensitivity beyond the targeted emission from the host). To model the full extent of the molecular gas in and around this system, in a resolved fashion, is beyond the scope of this work. Comparably sensitive multi-J CO line measurements surrounding the central host are required to determine a more complete estimate of the molecular gas mass and other properties, and the following physical properties of the cold ISM we derive are relevant to the emission only within the common aperture centred on the host. Appendix A presents more details on the data reduction, observational details, continuum-subtracted spectra, and velocity-integrated line flux densities for each line (Fernández Aranda et al. 2024, 2025).
3. TUNER modelling of the molecular gas and dust
We simultaneously modelled the observed dust continuum and CO line fluxes using the TUrbulent Non-Equilibrium Radiative transfer (TUNER) model. The underlying framework for the TUNER model is described in detail in Harrington et al. (2021), with a few updates that will be described in a forthcoming paper (Boogaard et al., in prep.). We also refer the reader to Strandet et al. (2017), Jarugula et al. (2021) for additional applications of the model. Briefly, the LVG approximations to the non-LTE radiative transfer calculations assume a lognormal volume density distribution (Padoan et al. 1997; Krumholz & McKee 2005) with a central density and width ΔV set by the turbulent velocity dispersion of the system. The different density bins that sample this distribution and are summed to derive the total observed emission and subsequent molecular gas and dust properties after optimising for the free parameters that are described in Appendix B) and listed in Table 1.
50th percentile parameter values and 16th and 84th percentile upper and lower limits, including fixed input parameters.
3.1. Line and dust spectral energy distribution
Figure 2 reveals the CO line excitation ladder of W2246–0526, one of the most extreme CO ladders ever reported. Measurements between CO(7–6) and CO(12–11) prevent us from determining the exact peak in the CO line SED. The dispersion between the 16th and 84th percentile values in the model fits suggest such strong CO emission is present such that the turnover appears to be traced by the CO(12–11) transition in the central host of W2246–0526. Figure B indicates that the total CO emitting size area is ∼3 kpc2 from the model-derived emitting radius of ∼1 kpc. This is consistent with the effective stellar radius of the galaxy (Fan et al. 2018), and with the region from which we expect the CO and dust emission to arise from (Fernández Aranda et al. 2024, 2025). Although this result matches previous independent estimates, the finest spatial resolution corresponds to ∼2.5 kpc. The CASA task imfit was used to fit a 2D Gaussian model of the CO(12–11) line emission, which is only marginally resolved. The deconvoled FWHM (full width at half-maximum) major and minor axis sizes of 1.7(±0.26) kpc × 0.98(±0.52) kpc provide an upper limit to the size, but it is consistent with the above results from the TUNER modelling and the effective stellar radius. We also note that Harrington et al. (2021) explains that an assumption in such a model is that the observed emission comes from a filled, face-on disc with a total source solid angle and effective radius. This total area is then divided into corresponding areas following the density distribution. This may not reflect the true source size, as it depends on how the molecular gas and dust emission is distributed within the source solid angle. The radius derived for each density therefore represents the typical sizes of those clouds, but not the actual size centred on the source. The dust SED is dominated by dust emission associated with molecular gas with density log(n(H2)) ∼ 2 − 4 cm−3, a median dust temperature of ∼100 K and βd ∼ 2.3. The median dust temperature is consistent with the uniform temperature derived in the modified blackbody fits of Fernández Aranda et al. (2025). In the TUNER modelling approach we did allow for possible values out to ∼2000 K to consider solutions with warmer dust, although the emission that is described by the model corresponds only far-IR radiation. Here we neglect any shorter wavelength measurements of a possible hot dust component that may reveal an additional dust mass / heating source associated with this system and may further contribute to the observed line emission. This may be particularly important for explaining the excitation of the highest-J lines observed. Future work will be able to use the complete IR SED to better characterise this extreme system.
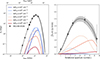 |
Fig. 2. TUNER model fits to the observed data (black circles) for the dust and CO line SEDs. The 50th percentile is shown by a dotted black line and the 16–84th percentile range as a shaded grey region. The representative density contributions to the observed dust (left) and CO line (right) SED from each molecular gas density bin of log(n(H2)) [cm−3] = 1 (dark blue), 2 (blue), 3 (light blue), 4 (light orange), 5 (orange), and 6 (red) are shown in solid coloured curves. |
The CO emission lines have roughly equal contributions from densities log(n(H2)) ∼ 3 − 5 cm−3 up to about J = 3. We determine that a significant contribution to the observed high-J line emission arises from molecular gas with density log(n(H2)) ∼ 4 − 5 cm−3. Two examples of QSOs with CO(12–11) or higher-J CO measurements include the lensed radio-quiet QSO BRI0952 (Omont et al. 1996; Kade et al. 2024) and the optically-selected QSO SDSSJ1148 (Fan et al. 2003; Gallerani et al. 2014), the latter with CO(17–16) detected, but no measurements between CO(7–6) and CO(17–16). The extreme CO excitation in W2246–0526 results in a CO(7–6) velocity integrated line intensity that is about two to four times higher than these highly excited QSOs. The steeply rising CO line SED shape has previously been found in only a few systems, such as the strongly lensed, broad absorption line QSO APM 08279+5255 (magnified IR luminosity ∼7 × 10¹⁵ L⊙ hereafter ‘APM0827’) with measurements out to CO(11–10) (Irwin et al. 1998; Weiß et al. 2007). APM0827 has a highly uncertain magnification factor, reflecting the challenges in studying lensed objects. It still remains one of the few examples of the most highly excited CO emission that can be compared to the unlensed W2246–0526. Similar LVG modelling has been applied using a two-component LVG model (Weiß et al. 2007) that is effectively the same underlying model as TUNER. The density distribution has been implemented in TUNER, which is the biggest change from the LVG model by Weiß et al. (2007). The overall parameter fits to the observed line SED for APM0827 provide a useful reference; however, model uncertainties may have systematic differences that remain beyond the scope of this work (e.g. comparisons between one- or two-component models versus those following density distributions in Harrington et al. 2021). Future applications of the TUNER model will examine the nature of CO line excitation in a larger sample of QSOs. APM0827 has a turnover at CO(10–9), and the high-J emission can be described by a dense component with log(n(H2)) ∼ 5 cm−3 within an apparent, magnified emitting size radius of ∼900 pc. The intrinsic value is subject to the systematic uncertainty in the lens model, but is within 10s to 100s pc. W2246–0526 has similar densities and high excitation as APM0827, although the turnover in the CO line SED is around CO(12–11). Lower densities cannot reproduce the observed line SEDs for both APM0827 and W2246–0526. The biggest difference (see Appendix B.1) is found in the median values of Tk at these densities for W2246–0526. The values of Tk > 300 K higher than the 60–70 K reported in APM0827 (Weiß et al. 2007). Therefore, W2246–0526 likely features the most highly excited global CO ladder reported in a galaxy to date.
The normalised CO partition function is shown in Figure 3. This demonstrates the contrast between the Milky Way (MW) centre (Fixsen et al. 1999) and W2246–0526. In the MW, ∼50% of the CO column resides in the J = 0 and J = 1 states, while this fraction drops to ∼10% for W2246–0526. The bulk of the CO molecules exist at the lowest level populations in the Milky Way, reflecting the more extreme CO excitation in W2246–0526 as it has a broader distribution of level populations out to higher-J levels.
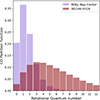 |
Fig. 3. CO partition function for W2246–0526 (red) and the Milky Way centre (purple; Fixsen et al. 1999). |
3.2. Characterizing the extreme ISM properties
W2246–0526 is known to have one of the highest reported bolometric luminosities of any galaxy. Our best-fit parameters derive a median IR luminosity  L⊙. Combined with the existence of an active SMBH with estimated mass MSMBH ∼ 6 × 10⁹ M⊙ (Tsai et al. 2018; Liao et al. 2025), one would suspect that this is the powering source for the higher-J line emission. From the best-fit line SEDs we determine that the molecular gas that contributes to the higher-J lines, with densities log(n(H2)) ∼ 4 − 5 cm−3 (and gas kinetic temperatures Tk ∼ 250 − 500 K) subtends an area less than 100 pc on average for these dense clouds, yet higher spatial resolution is needed to determine the actual distribution within the modelled source solid angle. One might assume that such compact regions responsible for the higher-J CO excitation are in agreement with the known dust-obscured SMBH in this central host; however, the TUNER model does not specifically attribute the observed emission to any heating source nor any radial distribution. One can only speculate that such activity from the active SMBH of the central Hot DOG may be directly responsible for the extreme CO excitation. The high mean gas kinetic temperature Tk ∼ 408 K, high dust temperatures Td ∼ 96 K, and importantly the high mean value of ⟨Tk/Td⟩ = 4.3 ± 1.7, all point towards the need for a strong powering source. The current spatial resolution prevents us from directly connecting the relatively high value of ⟨Tk/Td⟩ in the central core of this host Hot DOG to SMBH activity. This motivates future work with, for example, the most extended configurations of ALMA. Harrington et al. (2021) alluded to this ratio as a potential indicator of the relative mechanical versus photoelectric heating of an object; therefore, with a priori knowledge of this being a dust-obscured QSO, it is important to explore the known properties with respect to this high value. Independent estimates of the value of Tk/Td ∼ 2 have also been reported for local starbursts with LIR ∼ 1011 − 12 L⊙ (Díaz-Santos et al. 2017). The fact that this ratio is close to four suggests strong mechanical energy within W2246–0526 as compared to starburst activity. The energetic activity from this obscured SMBH must therefore be able to permeate the ∼3 kpc2 emitting area to boost the Tk/Td ratio to high values. This is reflected by the TUNER model results with turbulent velocity dispersions of 100s km s−1 that are consistent with reported FWHM measurements for W2246–0526, that are ∼500 km s−1 (Díaz-Santos et al. 2016, 2021). The high value of Tk/Td is also consistent with recent evidence of strong outflows and widespread shocks within the same area of W2246–0526 based on JWST spectra (Vayner et al. 2025). The turbulent gas in the PASSAGES (Harrington et al. 2016; Berman et al. 2022)1 galaxies, with LIR ∼ 1013 − 14 L⊙, revealed relatively high values in the range between Tk/Td = 2.5–3.5, yet W2246–0526 has an even higher mean ⟨Tk/Td⟩∼4.3. This motivates further analyses of a wider population range (e.g. starbursts, AGNs, QSOs and Hot DOGs), with well-sampled dust and CO line SEDs, to examine whether or not Tk/Td values may be used as a diagnostic for the most extreme phases of galaxy evolution. One of the free parameters in the model that allows us to better interpret the high molecular gas kinetic-to-dust temperature nature of this source is γT, which helps to constrain the temperature-density degeneracy (see Fig. B.1), and is defined as a power-law slope index as Tk ∝ nγT (Harrington et al. 2021). The posterior distributions suggest reasonable fits within the 16th and 84th percentiles of γT ranging from ∼−0.1 to 0.1. Typical molecular clouds have a negative γT values, such that denser gas becomes colder (leading to collapse). However, in this extreme object the dust and CO line SEDs can be reproduced with a positive value of γT, implying dense gas is hotter than less dense gas. This is independent of any knowledge that this is an active dusty SMBH with a strong central heating source.
The molecular gas-to-dust-mass ratio (GDMR) and [CO/H2] gas-phase abundance are also set as free parameters, and we are able to estimate these values for the first time based on the TUNER models. As shown in Fig. B.1, the 16th-84th percentile values of [CO/H2] range between log[CO/H2] = −4.6 and −3.4, with a median value of log[CO/H2] ∼ −3.95. This is close to the local Galactic value (i.e. log[CO/H2] ∼ −4.1) at solar metallicity, yet this galaxy is observed only 1.28 Gyr after the Big Bang. Evidence still suggests a large amount of molecular gas mass, with respect to dust mass, may reside in the host of W2246–0526, with the 16th-84th percentile range of GDMR ∼ 280–690. For such a comparable CO abundance, as in local calibrations within the Milky Way, one may expect values closer to a more nominal GDMR ∼ 150. Such values are possible (Appendix B.1), yet the mean value of GDMR ∼ 500 suggests that, at z = 4.6, this extreme object may have differences in the dust grain properties compared to the Milky Way. The inferred dust mass Md ∼ 108 M⊙ implies a significant amount of dust, and therefore metals, to suggest the metallicity is likely not extremely low. Understanding the GDMR, and how the CO gas-phase abundance and other parameters may be related requires further investigation that is beyond the scope of this work. We note, however, that there is a systematic unknown factor in the choice of the dust mass absorption coefficient value and the frequency at which it is normalised that can vary by up to a factor of three (Draine & Li 2007; Draine 2011).
3.3. Understanding which CO lines trace the molecular gas mass for the highly excited W2246–0526
Here we explore how the model-derived molecular gas mass and CO line luminosities relate to one another. This enables a self-consistent approach to better understand how some CO emission lines may better trace the molecular gas mass in W2246–0526 and similarly excited objects. That is, we explicitly calculated the CO line luminosity to molecular gas mass conversion factor αCO = MISM/L′CO [M⊙ (K km s−1 pc2)−1] and plotted the normalised molecular gas mass distribution produced by the TUNER model fits (Figure 4). Then, to determine what CO lines best share the same overlap in density, the relative line luminosities are compared to the corresponding peak in the molecular gas mass distribution. This approach to determine the best CO emission lines tracing the molecular gas mass is different than what is commonly done. We are explicitly calculating the molecular gas mass via dust and CO modelling of the physical parameters without resorting to an αCO using common assumptions. The current measurements and analyses are thereby limited by the uncertainties in the parameters used to derive this conversion factor, and modelling the host within W2246–0526 implies that an even more complete picture of the total molecular gas mass content from the entire field could still be determined2. That is, we neglected the contribution to the total molecular gas mass from the possible extended component seen in the CO(2–1) line measurements (e.g. Figs. 1, A.1, as well as Díaz-Santos et al. 2018).
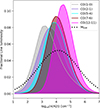 |
Fig. 4. Distribution of the fractional line luminosity per transition of CO (coloured lines and shaded regions; increasing in transition from left to right) versus density, with the normalised molecular gas mass distribution (dashed black line). |
Following Equation (5) in Harrington et al. (2021), we calculated the mean total molecular gas mass for the central region of W2246–0526 using the model-fit parameters (and including the mass contribution from He), including the emitting size radius and the central density, and width, of the lognormal PDF: MISM = (7.75 ± 3.39)×1010 M⊙. We further derived the corresponding molecular gas mass conversion factors for the central host from the model line luminosities that best fit the observed data following (Harrington et al. 2021). Local calibrations to molecular gas mass using the CO(1–0) line are well-justified because the typical temperatures and densities are quite low, with the level populations heavily weighted by the ground-state and J = 1 levels (see Figure 3). This was noted by Harrington et al. (2021) when modelling strongly lensed starbursts with LIR ∼ 1013 − 14 L⊙, revealing a wide range of observed line SEDs (and varying CO partition functions). For W2246–0526, the bulk of the CO molecules that contribute to the molecular gas mass are found to be at densities log(n(H2)) [cm−3] ∼3.5–5.5. The observed mid-J CO lines in the centre of W2246–0526 that are responsible for the gas at these densities, for example J = 3–6, are more heavily populated than the J = 0 or 1 levels. This is contrary to low-excitation gas conditions in the Milky Way, where the bulk of the molecular gas mass can be traced by the CO(1–0) emission line. The αCO factor for each transition can be derived for W2246–0526 using the ratio of the model-fit line luminosity for each transition and the total molecular gas mass (Harrington et al. 2021). The relative uncertainties in the model-derived conversion factor are all within 1-σ for the low/mid-J transitions. For transitions CO(1–0), CO(2–1), CO(5–4) and CO(7–6) we find a mean value of αCO(1 − 0) = 2.50 ± 2.03, αCO(2 − 1) = 1.57 ± 0.9, αCO(5 − 4) = 1.72 ± 0.76, αCO(7 − 6) = 2.29 ± 0.98 M⊙ (K km s−1 pc2)−1. The larger uncertainty in the αCO(1 − 0) value in these models largely stems from not having the measured CO(1–0) line. The extreme excitation also leads to optical depth effects resulting in solutions with optically thin CO(1–0) line emission (Harrington et al. 2021), and therefore a wider uncertainty in deriving the CO(1–0) line luminosity. Regardless, the peak of the partition function remains shifted to higher levels for this extreme galaxy, and the mass can be similarly traced by higher-J transitions. Figure 4 further demonstrates why it may be challenging to use CO(1–0) as a tracer of the bulk molecular gas mass for such highly excited systems as the centre of W2246–0526. In Sect. 3.1 we report that only ∼10% of the molecular gas column density is traced by the CO(1–0) line emission in this extreme source. Figure 4 shows that although the CO(1–0) line luminosity distribution versus density traces the densities which correspond to the peak of the molecular gas mass versus density distribution, the higher-J CO line luminosities have distributions centred on the mass distribution. Between the CO(7–6) to CO(12–11) line luminosity distributions there is an overlap with the peak of the molecular gas mass distribution. The resulting shift towards higher level populations (Figure 3) is a stark contrast to Milky Way conditions. For systems such as the central host of this Hot DOG, it may be easier to observe a low-to-mid-J CO line and directly apply a conversion factor of αCO(J = 2 − 1 to 5 − 4) ∼ 1.5 − 2.0 M⊙ (K km s−1 pc2)−1. We note that without sensitive measurements of the mid-to-high-J CO lines in the possible extended component it is not possible to conclude that the cool gas associated with the neighbouring systems (Díaz-Santos et al. 2016, 2018; Vayner et al. 2025; Fernández Aranda et al. 2025) around the centre of W2246–0526 may also be better traced by the higher-J transitions, as there may be less excited CO. If the CO line SED is much less excited than the centre of W2246–0526 then the lower-J lines such as CO(2–1) may better trace the environment around the host for a total molecular gas measurement, demonstrating the importance of determining the CO partition function for each system. Refined calibrations are required in a larger sample to minimise uncertainties in order to accurately determine molecular gas masses under such extreme conditions. Insights from modelling the full dust and CO line SED of W2246–0526 suggests that it may be more appropriate to measure the CO lines with J ≥ 3 to trace the bulk of the molecular gas mass for such extreme systems.
4. Summary and conclusions
Since 2015, W2246–0526 has been known to be among the most IR luminous galaxies ever discovered (Tsai et al. 2015). Despite this, there has yet to be a multi-J CO radiative transfer analysis of any of the WISE-selected Hot DOGs to characterise the physical conditions of the molecular gas and dust. There have been only a handful of QSO samples that have multiple CO lines, the most extreme example being the strongly lensed APM0827. This study therefore presents the first analysis of the rise and fall of the CO line SED of any WISE-selected Hot DOG, establishing a benchmark reference for future work of these extreme systems with dust-obscured nuclear activity. W2246–0526 has extreme gas excitation, with a detection of the high-J CO(12–11) emission line and evidence of the CO(17–16) line, which indicates that future high-J line observations of such high-redshift objects is feasible with current facilities.
We performed a kiloparsec-scale analyses using the TUNER model, which simultaneously fits both the dust and CO line SEDs in the framework of a turbulence driven lognormal probability distribution of molecular gas densities. This initial modelling of the extreme conditions indicated that measurements of such high-J lines are required to characterise the contribution from the dense molecular gas in this Hot DOG. The highly excited CO line SED required a combination of high gas density and kinetic temperature. This motivates future work to examine the rise and fall of the CO line SEDs in a larger sample to refine our understanding of the physical molecular gas properties of such high-excitation CO (e.g. X-ray dominated regions, Gallerani et al. 2014). The molecular gas mass close to 1011 M⊙ infers an abundant amount of material within the vicinity of this active SMBH(∼50 − 100× the mass of the SMBH). The plethora of sources of kinetic activity and mechanical heating have already indicated an extreme environment within W2246–0526. ALMA [CII] measurements at ∼0.07″ (450 pc) suggested the host can be resolved down to a radius less than 0.25″ with this dust-obscured SMBH evidently injecting radiative and mechanical feedback within ∼3 kpc2 (Liao et al. 2025). We found independent evidence of strong mechanical heating reflected in the TUNER model results, with values of Tk/Td ∼ 4.3 within a similar area. This ratio may be a key diagnostic for the molecular ISM excitation conditions of the most extreme systems. With current facilities it may not be feasible to further resolve all lines down to 10s to 100s of pc scales in a reasonable amount of integration time. Such efforts will require next-generation facilities to systematically examine the CO emitting regions around the core area of Hot DOGs and other systems to spatially resolve the conditions of these short-lived galaxy episodes of heavily dust-obscured SMBH activity.
Planck All-Sky Survey to Analyze Gravitationally lensed Extreme Starbursts; https://sites.google.com/view/astropassages
E.g. measuring warm molecular gas within the field or faint atomic carbon line emission that may trace molecular gas in regions with photodissociated CO.
Acknowledgments
We would like to thank the referee for their insightful and engaging comments that have significantly improved this manuscript. KCH would like to thank Amit Vishwas, Melanie Kaasinen and Carlos De Breuck for useful discussions. KCH would like to thank the European Southern Observatory for their generous science travel support during this work, and for the astronomy department at the Universidad Diego Portales for being such warm hosts last year. KCH thanks Mary and Mike Gyra for their guidance and support in the final stages of this manuscript. KCH and RFA thank the Instituto Roca Negra for their kind hospitality and work environment. MA is supported by FONDECYT grant number 1252054, and gratefully acknowledges support from ANID Basal Project FB210003 and ANID MILENIO NCN2024 112. RJA was supported by FONDECYT grant number 1231718 and by the ANID BASAL project FB210003. CWT is supported by NSFC 12588202, 11988101, and the International Partnership Program of the Chinese Academy of Sciences, Grant No. 114A11KYSB20210010. Part of this research was carried out at the Jet Propulsion Laboratory, California Institute of Technology, under a contract with the National Aeronautics and Space Administration (80NM0018D0004). The research leading to these results has received funding from the European Union’s Horizon 2020 research and innovation programme under the Marie Skłodowska-Curie RISE action, Grant Agreement n. 873089 (ASTROSTAT-II). T.D.-S. acknowledges the research project was supported by the Hellenic Foundation for Research and Innovation (HFRI) under the “2nd Call for HFRI Research Projects to support Faculty Members & Researchers” (Project Number: 3382). This paper makes use of the following ALMA data: ADS/JAO.ALMA#2015.1.00883.S,2016.1.00668.S,2017.1.00899.S, 2018.1.00119.S, 2018.1.00333.S, 2019.1.00219.S, 2021.1.00726.S. ALMA is a partnership of ESO (representing its member states), NSF (USA) and NINS (Japan), together with NRC (Canada), NSTC and ASIAA (Taiwan), and KASI (Republic of Korea), in cooperation with the Republic of Chile. The Joint ALMA Observatory is operated by ESO, AUI/NRAO and NAOJ.
References
- Berman, D. A., Yun, M. S., Harrington, K. C., et al. 2022, MNRAS, 515, 3911 [Google Scholar]
- Boogaard, L. A., van der Werf, P., Weiss, A., et al. 2020, ApJ, 902, 109 [NASA ADS] [CrossRef] [Google Scholar]
- Díaz-Santos, T., Assef, R. J., Blain, A. W., et al. 2016, ApJ, 816, L6 [Google Scholar]
- Díaz-Santos, T., Armus, L., Charmandaris, V., et al. 2017, ApJ, 846, 32 [Google Scholar]
- Díaz-Santos, T., Assef, R. J., Blain, A. W., et al. 2018, Science, 362, 1034 [Google Scholar]
- Díaz-Santos, T., Assef, R. J., Eisenhardt, P. R. M., et al. 2021, A&A, 654, A37 [NASA ADS] [CrossRef] [EDP Sciences] [Google Scholar]
- Draine, B. T. 2011, Physics of the Interstellar and Intergalactic Medium (Princeton: Princeton University Press) [Google Scholar]
- Draine, B. T., & Li, A. 2007, ApJ, 657, 810 [CrossRef] [Google Scholar]
- Eisenhardt, P. R. M., Wu, J., Tsai, C.-W., et al. 2012, ApJ, 755, 173 [Google Scholar]
- Fan, X., Strauss, M. A., Schneider, D. P., et al. 2003, AJ, 125, 1649 [Google Scholar]
- Fan, L., Gao, Y., Knudsen, K. K., & Shu, X. 2018, ApJ, 854, 157 [NASA ADS] [CrossRef] [Google Scholar]
- Fernández Aranda, R., Díaz Santos, T., Hatziminaoglou, E., et al. 2024, A&A, 682, A166 [NASA ADS] [CrossRef] [EDP Sciences] [Google Scholar]
- Fernández Aranda, R., Díaz Santos, T., Hatziminaoglou, E., et al. 2025, A&A, 695, L15 [NASA ADS] [CrossRef] [EDP Sciences] [Google Scholar]
- Fixsen, D. J., Bennett, C. L., & Mather, J. C. 1999, ApJ, 526, 207 [Google Scholar]
- Foreman-Mackey, D., Hogg, D. W., Lang, D., & Goodman, J. 2013, PASP, 125, 306 [Google Scholar]
- Gallerani, S., Ferrara, A., Neri, R., & Maiolino, R. 2014, MNRAS, 445, 2848 [Google Scholar]
- Harrington, K. C., Yun, M. S., Cybulski, R., et al. 2016, MNRAS, 458, 4383 [NASA ADS] [CrossRef] [Google Scholar]
- Harrington, K. C., Weiss, A., Yun, M. S., et al. 2021, ApJ, 908, 95 [NASA ADS] [CrossRef] [Google Scholar]
- Irwin, M. J., Ibata, R. A., Lewis, G. F., & Totten, E. J. 1998, ApJ, 505, 529 [NASA ADS] [CrossRef] [Google Scholar]
- Jarugula, S., Vieira, J. D., Weiss, A., et al. 2021, ApJ, 921, 97 [NASA ADS] [CrossRef] [Google Scholar]
- Kade, K., Knudsen, K. K., Bewketu Belete, A., et al. 2024, A&A, 684, A56 [NASA ADS] [CrossRef] [EDP Sciences] [Google Scholar]
- Krumholz, M. R., & McKee, C. F. 2005, ApJ, 630, 250 [Google Scholar]
- Liao, M., Assef, R. J., & Tsai, C. W. 2025, Science, submitted [Google Scholar]
- Martin, L. R., Blain, A. W., Díaz-Santos, T., et al. 2024, MNRAS, 534, 978 [Google Scholar]
- McMullin, J. P., Waters, B., Schiebel, D., Young, W., & Golap, K. 2007, in Astronomical Data Analysis Software and Systems XVI, eds. R. A. Shaw, F. Hill, & D. J. Bell, ASP Conf. Ser., 376, 127 [Google Scholar]
- Omont, A., McMahon, R. G., Cox, P., et al. 1996, A&A, 315, 1 [NASA ADS] [Google Scholar]
- Padoan, P., Nordlund, A., & Jones, B. J. T. 1997, MNRAS, 288, 145 [NASA ADS] [CrossRef] [Google Scholar]
- Penney, J. I., Blain, A. W., Assef, R. J., et al. 2020, MNRAS, 496, 1565 [Google Scholar]
- Strandet, M. L., Weiss, A., De Breuck, C., et al. 2017, ApJ, 842, L15 [Google Scholar]
- Sun, W., Fan, L., Han, Y., et al. 2024, ApJ, 964, 95 [NASA ADS] [CrossRef] [Google Scholar]
- Tsai, C.-W., Eisenhardt, P. R. M., Wu, J., et al. 2015, ApJ, 805, 90 [Google Scholar]
- Tsai, C.-W., Eisenhardt, P. R. M., Jun, H. D., et al. 2018, ApJ, 868, 15 [NASA ADS] [CrossRef] [Google Scholar]
- van der Tak, F. F. S., Black, J. H., Schöier, F. L., Jansen, D. J., & van Dishoeck, E. F. 2007, A&A, 468, 627 [NASA ADS] [CrossRef] [EDP Sciences] [Google Scholar]
- Vayner, A., Díaz-Santos, T., Eisenhardt, P. R. M., et al. 2025, ApJ, 989, 230 [Google Scholar]
- Weiß, A., Downes, D., Neri, R., et al. 2007, A&A, 467, 955 [NASA ADS] [CrossRef] [EDP Sciences] [Google Scholar]
- Wright, E. L., Eisenhardt, P. R. M., Mainzer, A. K., et al. 2010, AJ, 140, 1868 [Google Scholar]
- Wu, J., Tsai, C.-W., Sayers, J., et al. 2012, ApJ, 756, 96 [Google Scholar]
- Zewdie, D., Assef, R. J., Mazzucchelli, C., et al. 2023, A&A, 677, A54 [NASA ADS] [CrossRef] [EDP Sciences] [Google Scholar]
- Zewdie, D., Assef, R. J., Lambert, T., et al. 2025, A&A, 694, A121 [NASA ADS] [CrossRef] [EDP Sciences] [Google Scholar]
Appendix A: VLA and ALMA multi-J CO / continuum observation and reduction details
We imaged the visibility measurement sets to produce spectral cubes for the emission lines and continuum images using the tclean algorithm of the Common Astronomy Software Applications (CASA; McMullin et al. 2007) v6.5 for both the VLA and ALMA datsets. We used the Very Large Array (VLA) in its B and D configuration and the Q-band receivers to observe the redshifted CO(2–1) emission line at 41.16 GHz and a bandwidth of X GHz in each sideband. The B-array observations were executed September 12, 2017 to January 16, 2018 using the same tuning and correlator setup as the previous D-array observations. The data were reduced using the VLA calibration pipeline, with additional manual flagging of poor visibilities. Details of the D-array observations are provided in Díaz-Santos et al. (2018). The data were weighted, concatenated and imaged using CASA. All images were primary-beam corrected; however, the primary beam is much larger than the source. We used a Briggs weighting method, which balances sensitivity and angular resolution, and cleaned down to 2σ following Fernández Aranda et al. (2024, 2025). The final cube is obtained with a Briggs Robust parameter Robust = 2. This is effectively the same as a natural weighting, providing more weight to the inner antennas to achieve higher sensitivity. The final image cube has a width of 100 km s−1.
ALMA image processing was performed in a similar manner as the VLA observations, as we cleaned down to 2σ with Robust = 2 and 100 km s−1 channels following the methods in Fernández Aranda et al. (2024, 2025). To generate the line cubes, we first subtracted the visibilities corresponding to the frequencies that did not contain line emission using the CASA task uvcontsub. For the continuum, we combined all line-free channels from each dataset. The CO(17-16) line was detected only partially at the edge of a spectral window corresponding to a separate tuning targeting the [CII] emission line. We derived the estimated line flux density fitting the Gaussian amplitude while assuming a fixed FWHM of 600 km s−1 —Gaussian fits for the CO(2-1) to CO(12-11) lines give FWHM of
  km s−1 —, and assuming the line would be located at the same redshift of 4.601 as the other CO lines. When propagating the uncertainty in the CO(17-16) Gaussian fit, we conservatively introduced amplitude and sigma errors of 10% and 20%; however, for the modelling of the CO ladder and dust continuum SED we adopted a 100% uncertainty in the derived CO(17-16) line intensity. The moment-0 map (Fig. 2) was generated using only 20 channels corresponding to about one-third of the total CO(17-16) line emission. The continuum and CO line measured fluxes, the size of the synthesised beams, the depth of the observations, and the observed bands and project codes are presented in Table A.1.
To model the dust SED we adopted the extrapolated flux densities at the observed Herschel/ PACS(160 μm) and Herschel/ SPIRE (250 μm) wavelengths from the mean values and 1-sigma uncertainties reported in the resolved modified blackbody fits from (Fernández Aranda et al. 2025). This is instead of using the reported Herschel flux densities that include contributions from both hot/warm (mid-IR) and cold (FIR) emission from the host galaxy W2246–0526 (Tsai et al. 2018), and enabled us to estimate the turnover of the dust SED with greater precision and not overestimate the far-IR luminosity. The results are consistent with known values of the derived IR luminosity from the single temperature modified blackbody fits to the core emission presented in Fernández Aranda et al. (2025).
CO line and dust continuum emission measurements and details of the observations
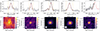 |
Fig. A.1. Top: Spectral line profiles for the measured CO lines using VLA/ALMA, centred on the same 0.6" aperture for each line, with flux density (y axis) vs redshifted velocity (x axis) at the source redshift. Gaussian fits are shown in red. The CO(17-16) line is partially detected at the edge of a spectral window. Bottom: CO moment-0 (velocity-integrated) values in Jy/beam km s−1 for the measured CO(2-1), CO(5-4), CO(7-6), CO(12-11) and CO(17-16). The black-dashed line in the CO(2-1) moment-0 image indicates the r = 0.6″ aperture used for extraction for all emission lines, corresponding to the central host in W2246–0526. We note that the map for CO(17-16) is generated using the available channels covering the line emission and is not corrected for the missing flux. |
Appendix B: Details on the TUNER modelling
Table 1 lists the free parameters that are fit and the median values and their ranges between the 16th and 84th percentile values. These include the [CO/H2] gas-phase abundance, the molecular gas-to-dust ratio (GDMR), mean dust temperature (Td) [K], dust emissivity index (βd), mean molecular H2 gas density (log(nH2) [cm−3], mean gas kinetic temperature TK [K], turbulence dispersion velocity (ΔV) [ km s−1] (i.e. the FWHM of the lognormal probablility density function distribution at a mean molecular gas density), emitting size radius (r) [pc] and Cff (unitless coefficient for the continuum foreground dimming). We fixed the virialisation parameter κvir at 1.3, and dust mass absorption coefficient κd = 0.047 m2 kg−1 at 352.7 GHz (Draine 2011). The marginalised 1D and 2D posterior distributions for all free parameters are shown in the corner plot in Figure B.1 with the mean value and 16th and 84th percentile limits.
We modelled the observed lines using the background continuum composed of half of the modified black-body dust continuum emission and the blackbody CMB radiation at the redshift of the object. There is a temperature floor imposed that is 10 K above the redshifted CMB radiation temperature floor in our modelling approach. Otherwise, the solutions with low temperatures would have invisible emission in contrast to the CMB radiation, leading to an inability to accurately constrain the gas excitation conditions. The temperature of the CMB radiation at the source redshift is less than 20 K. Therefore, this is not a concern for W2246–0526, as both the gas and dust temperatures are about 100 K or even greater. This temperature floor above the CMB radiation is not strictly necessary, yet it remains consistent with previous approaches in such modelling (e.g. Harrington et al. 2021). To further verify this, we also ran the model without any temperature floor. This did not change the results for any of the free parameters by more than 2%, due to the highly excited nature of this system. The only value that changed, by 20%, is the GDMR. The GDMR decreased when removing the temperature floor, but still remains within the uncertainties seen in Fig. B.1. Following Harrington et al. (2021) we constrained the parameter space to values of Tk / Td = 0.5 − 6.5, which reduced degeneracies and long tails in the posterior distribution for Tk. We coupled the H2 density and gas kinetic temperature with a power-law slope index as noted in Sect. 3. Still, there can be a wide-ranging and highly degenerate parameter space. The turbulent velocity dispersion has a long tail, although the peak of the distribution is at about 150 km s−1, which is a more plausible value. Similarly the GDMR has a broad distribution, with lower values consistent with known values of about 150-200. We employed the Markov chain Monte Carlo emcee Python package (Foreman-Mackey et al. 2013), with uniform priors, 100 walkers and 50 autocorrelation times, where the autocorrelation time is stable to within a few percent.
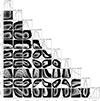 |
Fig. B.1. Corner plot of the marginalised 1D and 2D posterior distributions of the free parameters optimised in our TUNER model fits. Dashed lines indicate the mean value and 16th and 84th percentile range for each parameter (from top to bottom and left to right: Cff, molecular ISM gas to dust ratio, GDMR, molecular H2 gas density log(nH2) [cm−3], gas kinetic temperature TK [K], emitting size radius (r) [pc], dust emissivity index (βd), γT, turbulence dispersion velocity (ΔV) [km s−1], dust temperature Td [K] and [CO/H2] gas-phase abundance). |
All Tables
50th percentile parameter values and 16th and 84th percentile upper and lower limits, including fixed input parameters.
CO line and dust continuum emission measurements and details of the observations
All Figures
|
Fig. 1. Velocity-integrated CO(12–11) line emission from the central region of W2246–0526 (host), the extended dust continuum emission at rest-frame 155 μm from Fernández Aranda et al. (2025) (pink contours), and the VLA B and D configuration CO(2–1) emission (cyan contours). The physical scale is shown in the lower right corner, with the corresponding synthesised beams (pink: dust continuum; cyan: CO(2–1); gold: CO(12–11)). The dash-dotted white circle indicates the r = 0.6″aperture used to extract the flux density measurements of the host; i.e. not including any of the extended emission. Contours reflect [4,5,6,...] × r.m.s) for CO(2–1), and [3, 2(n/2)] × r.m.s. (with n = 4,5,6,...) for the continuum. |
| In the text | |
|
Fig. 2. TUNER model fits to the observed data (black circles) for the dust and CO line SEDs. The 50th percentile is shown by a dotted black line and the 16–84th percentile range as a shaded grey region. The representative density contributions to the observed dust (left) and CO line (right) SED from each molecular gas density bin of log(n(H2)) [cm−3] = 1 (dark blue), 2 (blue), 3 (light blue), 4 (light orange), 5 (orange), and 6 (red) are shown in solid coloured curves. |
| In the text | |
|
Fig. 3. CO partition function for W2246–0526 (red) and the Milky Way centre (purple; Fixsen et al. 1999). |
| In the text | |
|
Fig. 4. Distribution of the fractional line luminosity per transition of CO (coloured lines and shaded regions; increasing in transition from left to right) versus density, with the normalised molecular gas mass distribution (dashed black line). |
| In the text | |
|
Fig. A.1. Top: Spectral line profiles for the measured CO lines using VLA/ALMA, centred on the same 0.6" aperture for each line, with flux density (y axis) vs redshifted velocity (x axis) at the source redshift. Gaussian fits are shown in red. The CO(17-16) line is partially detected at the edge of a spectral window. Bottom: CO moment-0 (velocity-integrated) values in Jy/beam km s−1 for the measured CO(2-1), CO(5-4), CO(7-6), CO(12-11) and CO(17-16). The black-dashed line in the CO(2-1) moment-0 image indicates the r = 0.6″ aperture used for extraction for all emission lines, corresponding to the central host in W2246–0526. We note that the map for CO(17-16) is generated using the available channels covering the line emission and is not corrected for the missing flux. |
| In the text | |
|
Fig. B.1. Corner plot of the marginalised 1D and 2D posterior distributions of the free parameters optimised in our TUNER model fits. Dashed lines indicate the mean value and 16th and 84th percentile range for each parameter (from top to bottom and left to right: Cff, molecular ISM gas to dust ratio, GDMR, molecular H2 gas density log(nH2) [cm−3], gas kinetic temperature TK [K], emitting size radius (r) [pc], dust emissivity index (βd), γT, turbulence dispersion velocity (ΔV) [km s−1], dust temperature Td [K] and [CO/H2] gas-phase abundance). |
| In the text | |
Current usage metrics show cumulative count of Article Views (full-text article views including HTML views, PDF and ePub downloads, according to the available data) and Abstracts Views on Vision4Press platform.
Data correspond to usage on the plateform after 2015. The current usage metrics is available 48-96 hours after online publication and is updated daily on week days.
Initial download of the metrics may take a while.