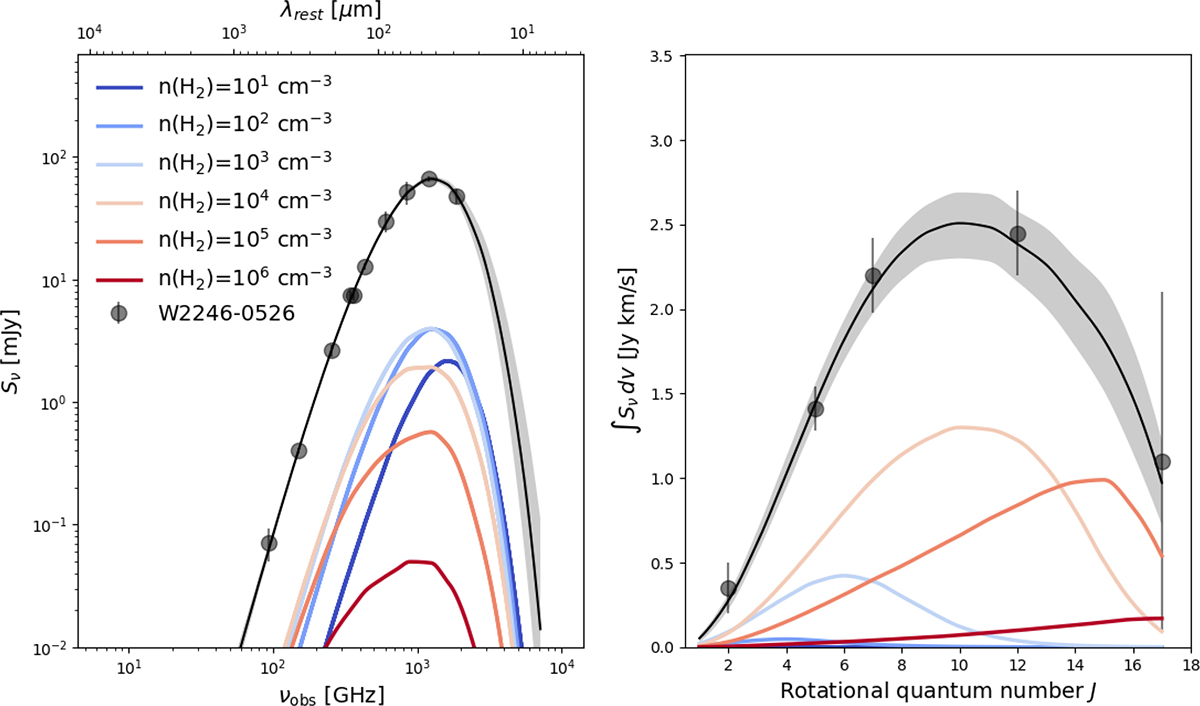
Fig. 2.
Download original image
TUNER model fits to the observed data (black circles) for the dust and CO line SEDs. The 50th percentile is shown by a dotted black line and the 16–84th percentile range as a shaded grey region. The representative density contributions to the observed dust (left) and CO line (right) SED from each molecular gas density bin of log(n(H2)) [cm−3] = 1 (dark blue), 2 (blue), 3 (light blue), 4 (light orange), 5 (orange), and 6 (red) are shown in solid coloured curves.
Current usage metrics show cumulative count of Article Views (full-text article views including HTML views, PDF and ePub downloads, according to the available data) and Abstracts Views on Vision4Press platform.
Data correspond to usage on the plateform after 2015. The current usage metrics is available 48-96 hours after online publication and is updated daily on week days.
Initial download of the metrics may take a while.