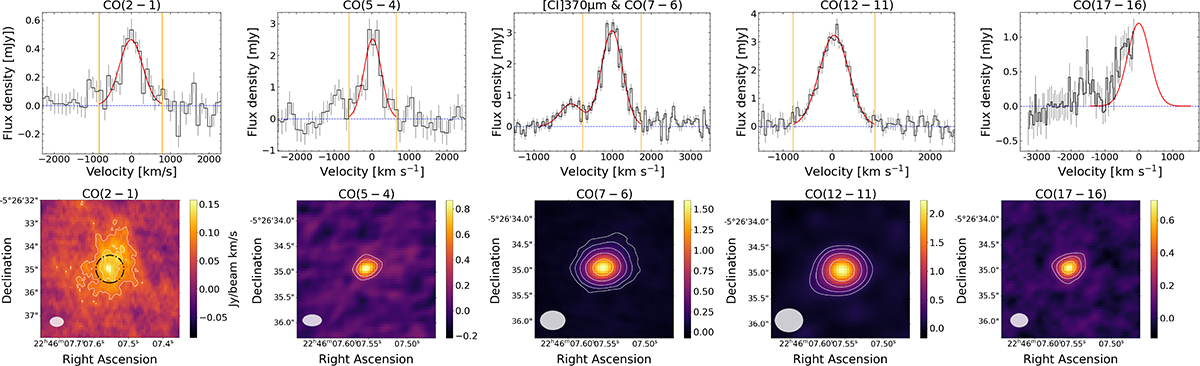
Fig. A.1.
Download original image
Top: Spectral line profiles for the measured CO lines using VLA/ALMA, centred on the same 0.6" aperture for each line, with flux density (y axis) vs redshifted velocity (x axis) at the source redshift. Gaussian fits are shown in red. The CO(17-16) line is partially detected at the edge of a spectral window. Bottom: CO moment-0 (velocity-integrated) values in Jy/beam km s−1 for the measured CO(2-1), CO(5-4), CO(7-6), CO(12-11) and CO(17-16). The black-dashed line in the CO(2-1) moment-0 image indicates the r = 0.6″ aperture used for extraction for all emission lines, corresponding to the central host in W2246–0526. We note that the map for CO(17-16) is generated using the available channels covering the line emission and is not corrected for the missing flux.
Current usage metrics show cumulative count of Article Views (full-text article views including HTML views, PDF and ePub downloads, according to the available data) and Abstracts Views on Vision4Press platform.
Data correspond to usage on the plateform after 2015. The current usage metrics is available 48-96 hours after online publication and is updated daily on week days.
Initial download of the metrics may take a while.