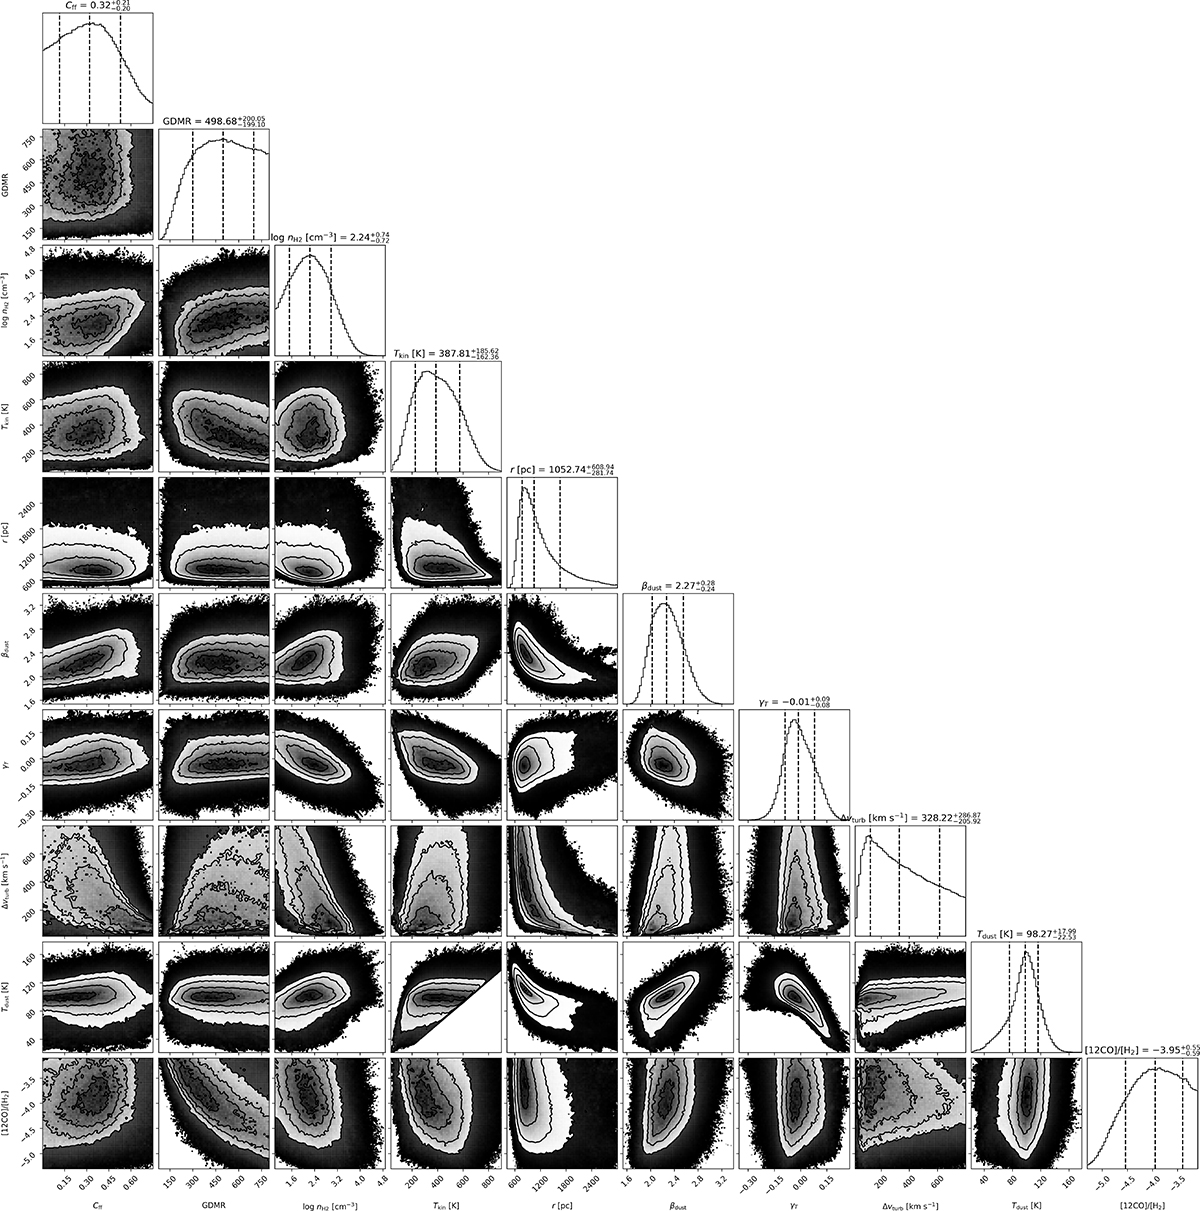
Fig. B.1.
Download original image
Corner plot of the marginalised 1D and 2D posterior distributions of the free parameters optimised in our TUNER model fits. Dashed lines indicate the mean value and 16th and 84th percentile range for each parameter (from top to bottom and left to right: Cff, molecular ISM gas to dust ratio, GDMR, molecular H2 gas density log(nH2) [cm−3], gas kinetic temperature TK [K], emitting size radius (r) [pc], dust emissivity index (βd), γT, turbulence dispersion velocity (ΔV) [km s−1], dust temperature Td [K] and [CO/H2] gas-phase abundance).
Current usage metrics show cumulative count of Article Views (full-text article views including HTML views, PDF and ePub downloads, according to the available data) and Abstracts Views on Vision4Press platform.
Data correspond to usage on the plateform after 2015. The current usage metrics is available 48-96 hours after online publication and is updated daily on week days.
Initial download of the metrics may take a while.