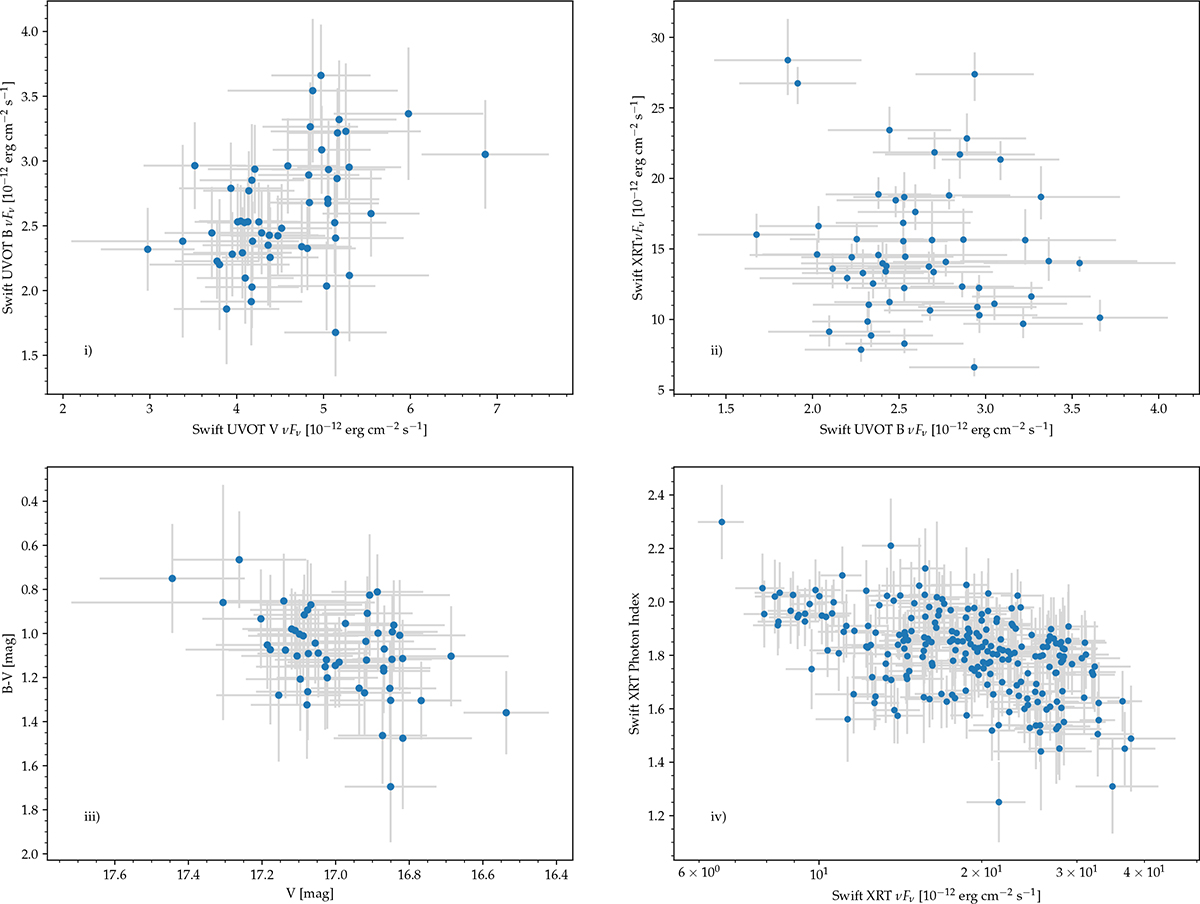
Fig. 2.
Download original image
Correlation plots for 1ES 0229+200. The following figures present flux-flux comparison of Swift/UVOT V and B filter; flux-flux comparison of Swift/UVOT V flux and Swift-XRT flux measured in the energy range of 0.3–10 keV; colour-magnitude diagram for V magnitude and B − V colour; flux-index comparison for Swift-XRT observations.
Current usage metrics show cumulative count of Article Views (full-text article views including HTML views, PDF and ePub downloads, according to the available data) and Abstracts Views on Vision4Press platform.
Data correspond to usage on the plateform after 2015. The current usage metrics is available 48-96 hours after online publication and is updated daily on week days.
Initial download of the metrics may take a while.