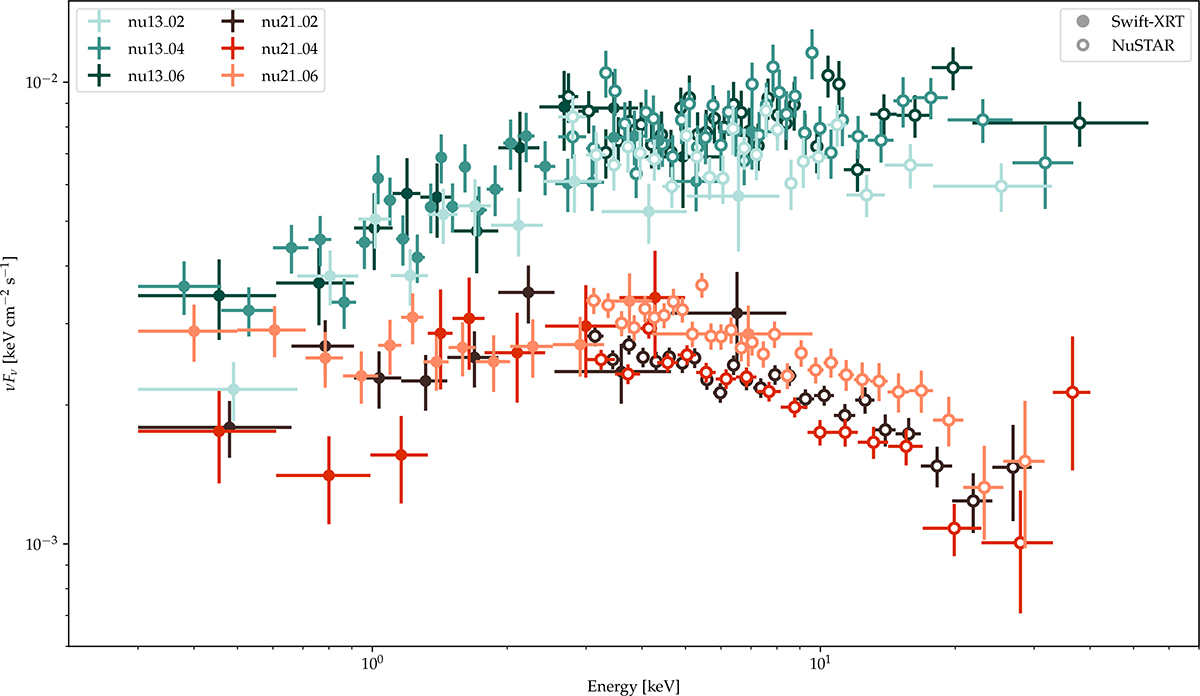
Fig. 3.
Download original image
Spectral energy distributions presenting NuSTAR and Swift-XRT observations for six epochs (3 in 2013 and 2021). Swift-XRT observations are corrected for the influence of the hydrogen Galactic column density with NH provided by Willingale et al. (2013). The last two digits of the label denote the ObsIDs of the NuSTAR observations. The Swift-XRT and NuSTAR observations are distinguished by filled and hollow markers, respectively. The full ObsIDs are listed in Table 1. In the case of 2013 NuSTAR data, spectral points are adopted from Wierzcholska & Wagner (2020).
Current usage metrics show cumulative count of Article Views (full-text article views including HTML views, PDF and ePub downloads, according to the available data) and Abstracts Views on Vision4Press platform.
Data correspond to usage on the plateform after 2015. The current usage metrics is available 48-96 hours after online publication and is updated daily on week days.
Initial download of the metrics may take a while.