Fig. 11
Download original image
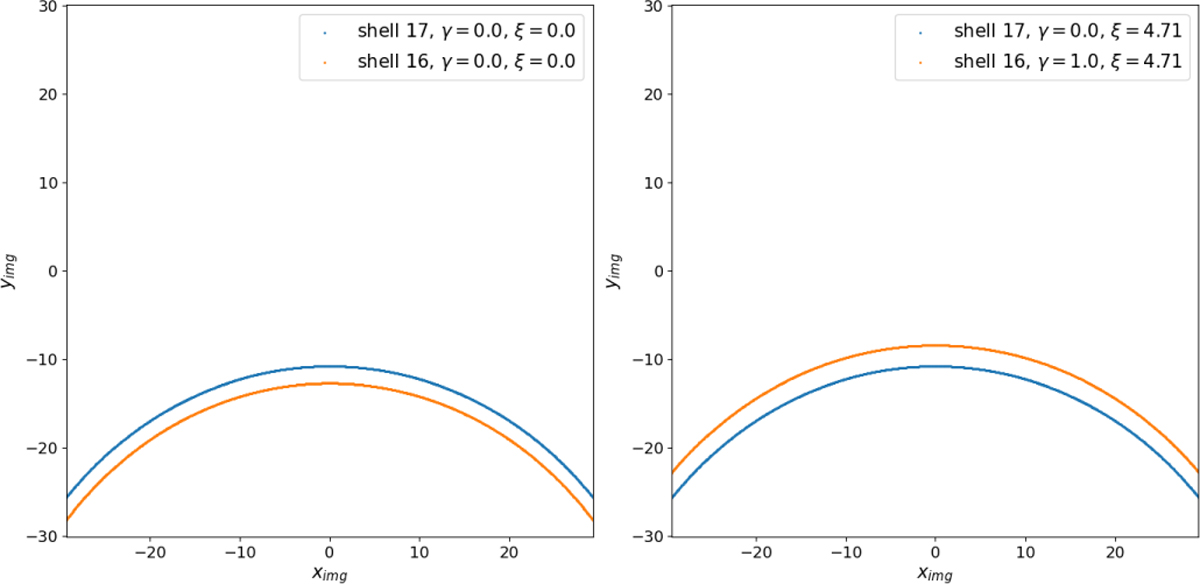
Arc patterns reproduced for shells 16 and 17 in two different configurations. Left: arcs reproduced under the perfect mirror hypothesis. Right: configuration where shell 16 is misaligned with amplitudes γ = 1′ and ξ = 3π/2. The result of these combinations produces an interchange between the order in which the shells can be visualized on the detector.
Current usage metrics show cumulative count of Article Views (full-text article views including HTML views, PDF and ePub downloads, according to the available data) and Abstracts Views on Vision4Press platform.
Data correspond to usage on the plateform after 2015. The current usage metrics is available 48-96 hours after online publication and is updated daily on week days.
Initial download of the metrics may take a while.