Fig. 9
Download original image
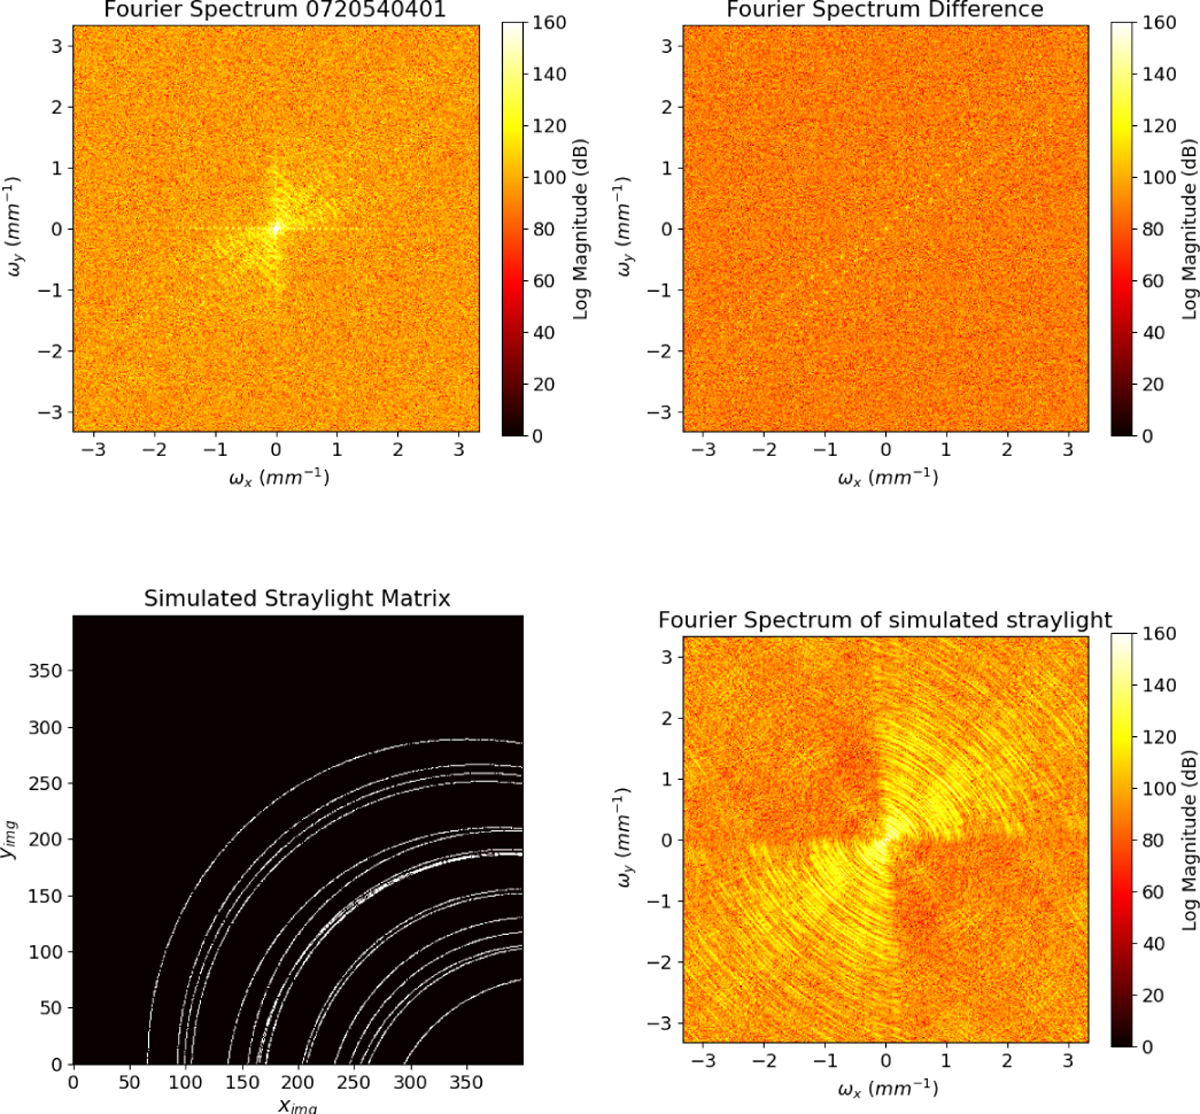
Fourier spectrum of the observation 0720540401 (top-left panel) and the spectrum of the matrix resulting from the difference between 0720540401 and 0720540601 after being properly rotated according to their PAs (top-right panel). The top-left panel shows particular features associated with the stray light with weak counterparts in the right panel. These arc-shaped features were reproduced by applying the Fourier transform to a simulated matrix with uniformly distributed tilt parameters (bottom-left panel), producing the plot shown in the bottom-right panel. ωx and ωy represent the frequencies along the two axes.
Current usage metrics show cumulative count of Article Views (full-text article views including HTML views, PDF and ePub downloads, according to the available data) and Abstracts Views on Vision4Press platform.
Data correspond to usage on the plateform after 2015. The current usage metrics is available 48-96 hours after online publication and is updated daily on week days.
Initial download of the metrics may take a while.