Fig. 3.
Download original image
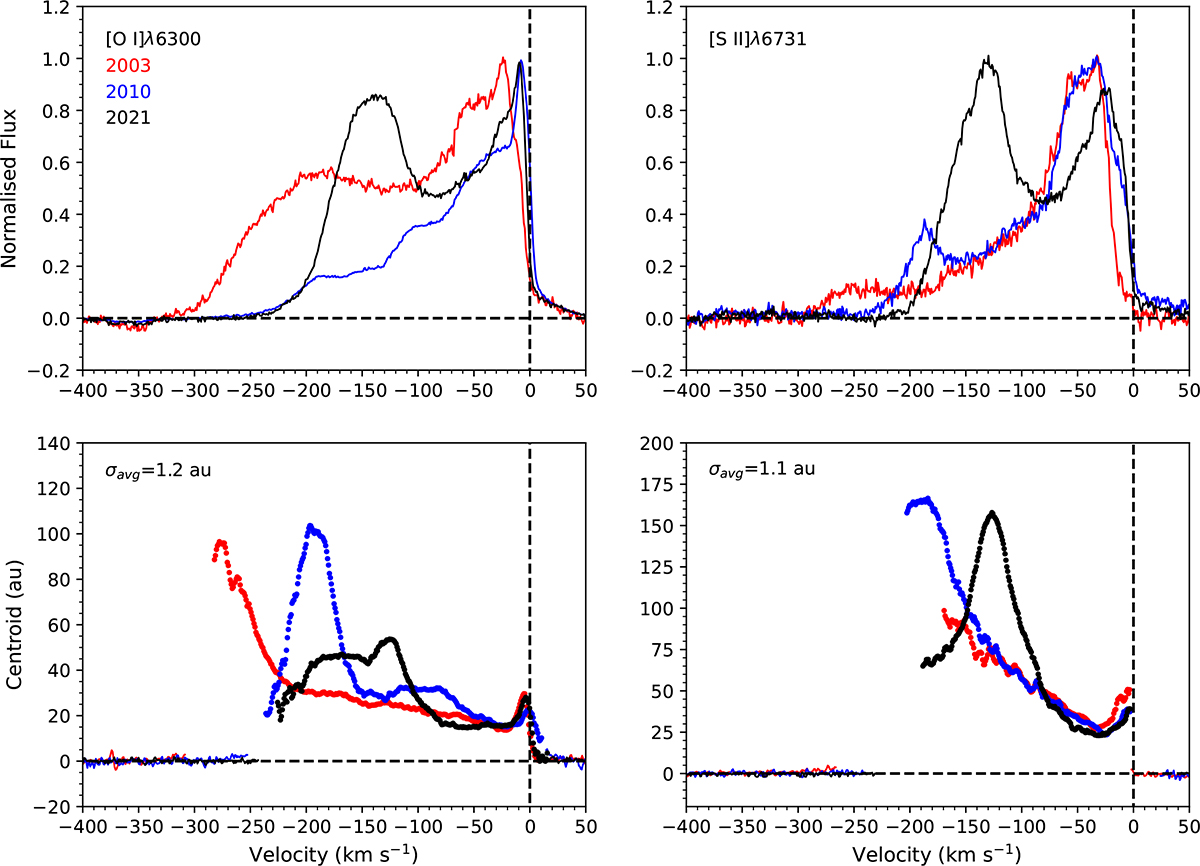
Top row: Comparison of the line profiles of [O I] λ6300 and [S II] λ6731 for each epoch of data. The line profiles are normalised to max peak height to emphasise changes in the line shape over time. Bottom row: Position spectra for the [O I] λ6300 and [S II] λ6731 lines in 2003 (red), 2010 (blue), and 2021 (black). The analysis of the [O I] λ5577 line is not presented here, as it does not show an extended jet component due to its high critical density.
Current usage metrics show cumulative count of Article Views (full-text article views including HTML views, PDF and ePub downloads, according to the available data) and Abstracts Views on Vision4Press platform.
Data correspond to usage on the plateform after 2015. The current usage metrics is available 48-96 hours after online publication and is updated daily on week days.
Initial download of the metrics may take a while.