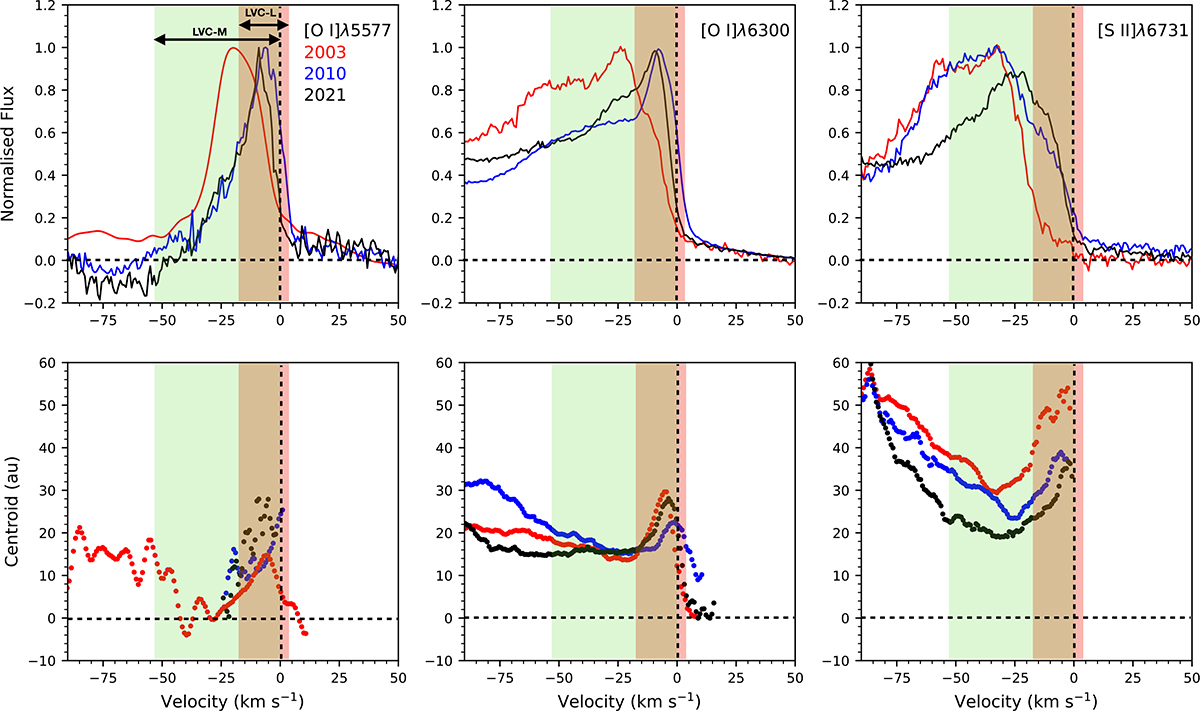
Fig. 4.
Download original image
Top row: Comparison of the line profiles in the LVC region of each FEL in each epoch of data. 2003 corresponds to the red line, 2010 corresponds to the blue line, and 2021 corresponds to the black line. These panels show a zoom-in on the line profiles shown in Fig. 3 from –90 to 50 kms−1. This is done to emphasise the change in line shape in the LVC region over time. The line profiles are normalised to max peak height. Bottom row: Position spectra of the LVC region for each FEL in each epoch of observation. 2003 corresponds to the red line, 2010 corresponds to the blue line, and 2021 corresponds to the black line. The 1σ uncertainties range from 1 to 5 au where 5 au is measured for the lowest S/N emission, i.e. [O I] λ5577 in 2021.
Current usage metrics show cumulative count of Article Views (full-text article views including HTML views, PDF and ePub downloads, according to the available data) and Abstracts Views on Vision4Press platform.
Data correspond to usage on the plateform after 2015. The current usage metrics is available 48-96 hours after online publication and is updated daily on week days.
Initial download of the metrics may take a while.