Fig. 1.
Download original image
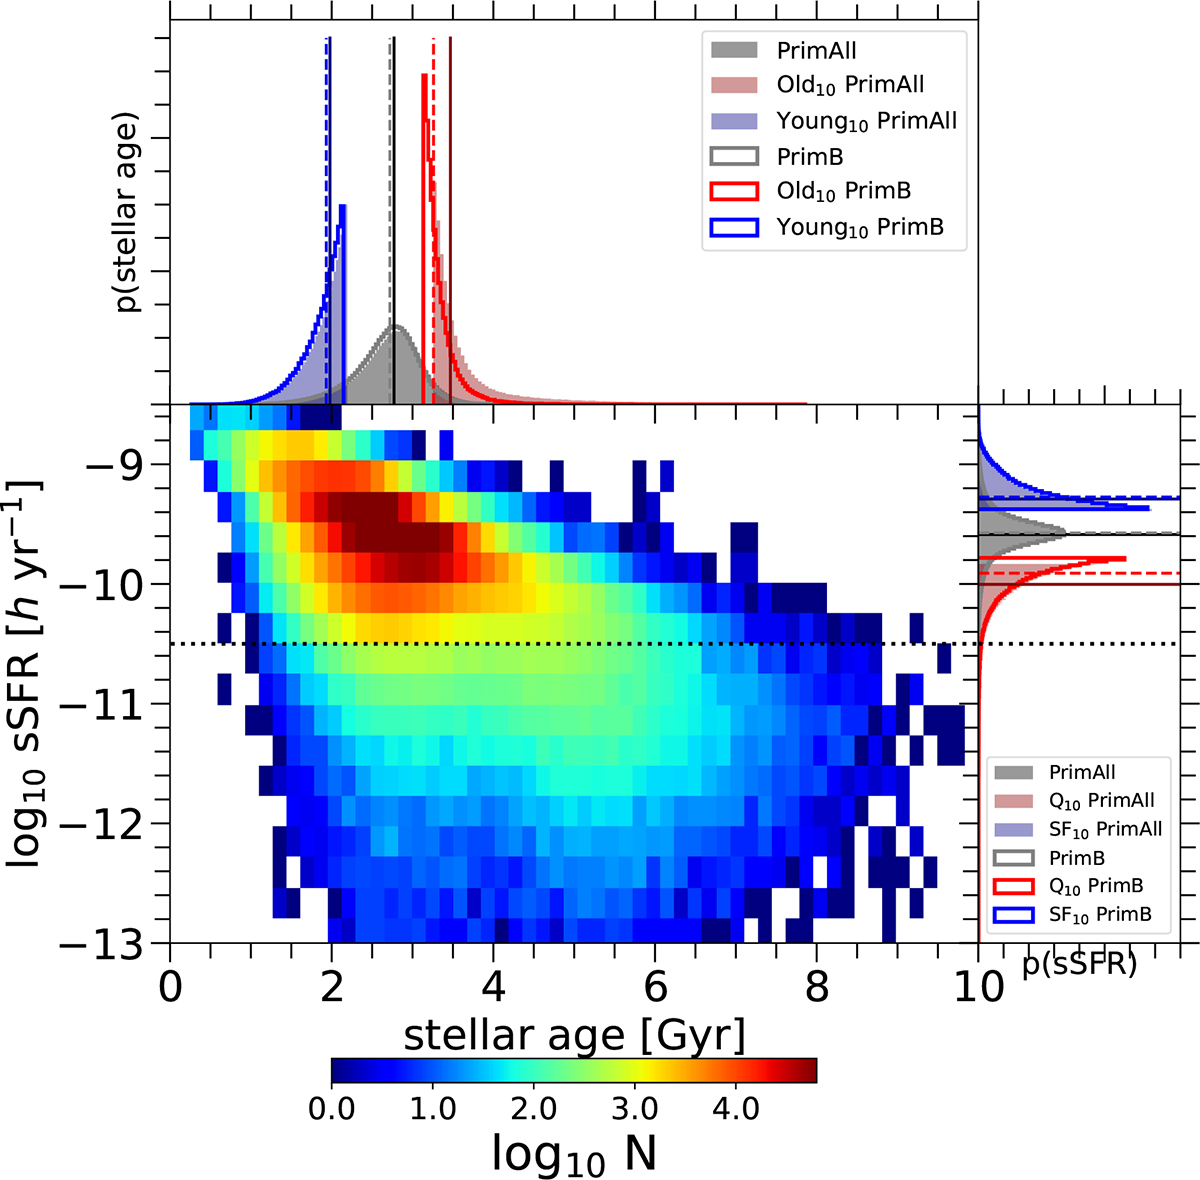
Distribution of sSFR as a function of stellar age for the low-mass central galaxies, represented by the number density of galaxies as indicated in the color bar (main panel). The horizontal dotted line shows the condition used to separate star-forming and quenched galaxies. The top and the right panels show the normalized density distributions of stellar age and sSFR, respectively, for the parent samples and sub-samples as indicated in the legends and described in Tables 1 and 2. The integral of each histogram sums to unity. The lines correspond to the median value for the PrimAll (solid) and PrimB (dashed) samples.
Current usage metrics show cumulative count of Article Views (full-text article views including HTML views, PDF and ePub downloads, according to the available data) and Abstracts Views on Vision4Press platform.
Data correspond to usage on the plateform after 2015. The current usage metrics is available 48-96 hours after online publication and is updated daily on week days.
Initial download of the metrics may take a while.