| Issue |
A&A
Volume 703, November 2025
|
|
|---|---|---|
| Article Number | A247 | |
| Number of page(s) | 11 | |
| Section | Extragalactic astronomy | |
| DOI | https://doi.org/10.1051/0004-6361/202555329 | |
| Published online | 18 November 2025 | |
Assessing the connection between galactic conformity and assembly-type bias
1
Instituto de Astronomía y Ciencias Planetarias, Universidad de Atacama, Copayapu 485, Copiapó, Chile
2
CONICET, Instituto de Astronomía Teórica y Experimental (IATE), Laprida 854, Córdoba X5000BGR, Argentina
3
Universidad Nacional de Córdoba (UNC), Observatorio Astronómico de Córdoba (OAC), Laprida 854, Córdoba X5000BGR, Argentina
⋆ Corresponding author: This email address is being protected from spambots. You need JavaScript enabled to view it.
Received:
28
April
2025
Accepted:
7
September
2025
Abstract
Context. Galaxies across the Universe display a conformity in the fraction of quenched galaxies out to large distances, which is much greater around quenched central galaxies than it is for star-forming ones. On the other hand, simulations have shown that the clustering of halos and the galaxies within them depends on secondary properties beyond the halo mass. This phenomenon is referred to as the assembly bias.
Aims. Our aim is to study whether samples that show galactic conformity also display an assembly bias. We also aim to see whether the amplitudes of these two effects are correlated.
Methods. We used synthetic galaxies at z = 0 from the semi-analytical model SAG run on the MultiDark Planck 2 (MDPL2) cosmological simulation. We measured both the conformity and galaxy assembly bias for different samples of central galaxies at a fixed host halo mass. We focused on central galaxies hosted by low-mass halos of 1011.6 ≤ Mh/h−1 M⊙ < 1011.8 because this is a mass range where a strong assembly bias has been reported. The samples of central galaxies were separated according to their specific star formation rates and stellar ages.
Results. We find that the level of conformity exhibited by our different samples is correlated with their measured level of assembly bias. We also find that removing galaxies around massive halos diminishes the conformity signal and lowers the amount of assembly bias.
Context. The high correlation in the amplitude of conformity and assembly bias for different samples, both with and without removing galaxies near massive halos, clearly indicates the strong relationship between both phenomena.
Key words: galaxies: clusters: general / galaxies: general / galaxies: groups: general / galaxies: halos / galaxies: star formation
© The Authors 2025
 Open Access article, published by EDP Sciences, under the terms of the Creative Commons Attribution License (https://creativecommons.org/licenses/by/4.0), which permits unrestricted use, distribution, and reproduction in any medium, provided the original work is properly cited.
This article is published in open access under the Subscribe to Open model. This email address is being protected from spambots. You need JavaScript enabled to view it. to support open access publication.
1. Introduction
As part of the current effort to understand galaxy evolution, studying the types of environments that galaxies reside in continues to be an area of intense focus. The reason is that fundamental galaxy properties such as the star formation rate and color can be affected by the environment, especially for low-mass galaxies (e.g., Peng et al. 2010; Bluck et al. 2014; Argudo-Fernández et al. 2018). Furthermore, low-mass galaxies exhibit environmental effects on megaparsec (Mpc) scales, typically well beyond the virial radius of galaxy groups and clusters (e.g., Wetzel et al. 2012; Bahé et al. 2013; Benítez-Llambay et al. 2013; Cybulski et al. 2014; Campbell et al. 2015; Hearin et al. 2015; Bahé et al. 2017; Goddard et al. 2017; Zheng et al. 2017; Zinger et al. 2018; Duckworth et al. 2019; Kraljic et al. 2019; Pallero et al. 2019; Tremmel et al. 2019; Zheng et al. 2019; Pandey & Sarkar 2020; Zhang et al. 2021; Lacerna et al. 2022).
One example of the impact from the large-scale environment is the two-halo galactic conformity (e.g., Kauffmann et al. 2013; Hearin et al. 2015, 2016; Kauffmann 2015; Paranjape et al. 2015; Bray et al. 2016; Berti et al. 2017; Sin et al. 2017, 2019; Calderon et al. 2018; Lacerna et al. 2018, 2022; Rafieferantsoa & Davé 2018; Sun et al. 2018; Tinker et al. 2018; Treyer et al. 2018; Zu & Mandelbaum 2018; Alam et al. 2020; Li et al. 2021; Ayromlou et al. 2023; Olsen & Gawiser 2023; Wang et al. 2023a; Palma et al. 2025). This term is used to describe the correlation of color or star formation activity between low-mass central galaxies, with stellar masses of M⋆ < 1010.5 M⊙, and their neighbor galaxies located in adjacent halos at separations of several Mpc. Kauffmann et al. (2013) found an observational two-halo conformity effect between low-mass central1 galaxies with a low specific star formation rate (sSFR) or low gas content and neighboring galaxies with low sSFR out to scales of 4 Mpc at z < 0.03. Cosmological hydrodynamical simulations (e.g., Bray et al. 2016; Wang et al. 2023a), semi-analytic models of galaxy formation (e.g., Lacerna et al. 2018, 2022; Ayromlou et al. 2023), and semi-empirical models (e.g., Sin et al. 2017; Tinker et al. 2018) also show a correlation in color or star formation between central galaxies and neighboring galaxies at Mpc scales.
Using mock galaxy catalogs, Sin et al. (2017) found that the two-halo conformity out to projected distances of 3−4 Mpc from central galaxies is primarily related to the environmental influence of very large neighboring halos. Lacerna et al. (2022) demonstrated that the low-mass (M⋆ ≤ 1010 h−1 M⊙) central galaxies that lie in the vicinity of massive systems are the ones most responsible for producing galactic conformity at Mpc scales. They used two galaxy catalogs from different versions of the semi-analytic model SAG (Cora et al. 2018) applied to the MultiDark Planck 2 cosmological simulation (Klypin et al. 2016; Knebe et al. 2018) and the ILLUSTRISTNG300 cosmological hydrodynamical simulation (Naiman et al. 2018; Nelson et al. 2018; Marinacci et al. 2018; Pillepich et al. 2018; Springel et al. 2018; Nelson et al. 2019). These authors consistently found that central galaxies in the vicinity of galaxy groups are primarily responsible for the correlation between the low-mass centrals and neighboring galaxies at large separations of several Mpc. Ayromlou et al. (2023) used a galaxy catalog from a semi-analytic model (LGal-A21, Ayromlou et al. 2021) and showed that the conformity signal (albeit not all of it) arises from central galaxies near massive systems.
On the other hand, Wang et al. (2023a) found that low-mass central galaxies from the Sloan Digital Sky Survey (SDSS, York et al. 2000; Blanton et al. 2005) are more quenched in high-density regions, which generally contain a massive halo that would lie close to these low-mass galaxies. They also found a similar trend in ILLUSTRISTNG300, which, according to the authors, can be entirely explained by “backsplash”2 galaxies. Recently, Palma et al. (2025) studied the evolution of low-mass central galaxies with M⋆ = 109.5 − 1010 h−1 M⊙ near massive groups and clusters of galaxies using the ILLUSTRISTNG300 and MDPL2-SAG catalogs. They found that former satellites (i.e., central galaxies at present that were satellites in the past as a simple way to define backsplash or fly-by galaxies) play an important role in the two-halo conformity signal in ILLUSTRISTNG300. These galaxies can explain the whole signal at z ∼ 1, while they contribute up to 75−85% at z ≲ 0.3. They found a negligible contribution of former satellites to the conformity signal in MDPL2-SAG. Regardless of the specific contribution of former satellites, the results from these works are consistent in that the two-halo galactic conformity is primarily produced by low-mass central galaxies near massive halos with halo masses of Mh ≥ 1013 M⊙.
Galaxy assembly bias is another phenomenon where the properties of a galaxy affect statistics on large separations well into the two-halo scale regime. It is not unreasonable then to study both galaxy assembly bias and conformity together. Galaxy assembly bias is often used to refer to the dependence of large-scale galaxy clustering on secondary halo properties beyond the halo mass. In the context of halo occupation distribution (HOD) modeling, galaxy assembly bias is described as the combination of assembly bias and the so-called occupancy variations; namely, the dependencies of the galaxy content of halos on secondary halo properties at fixed halo mass (Artale et al. 2018; Zehavi et al. 2018; Contreras et al. 2019). Cosmological numerical simulations (semi-analytical models and hydrodynamical models) tend to show the existence of an assembly-type bias on synthetic galaxies (e.g., Croton et al. 2007; Lacerna & Padilla 2011; Wang et al. 2013a; Salcedo et al. 2018; Montero-Dorta et al. 2020). However, it is still unclear whether this effect is present in observations (e.g., Skibba et al. 2006; Cooper et al. 2010; Wang et al. 2013b; Lacerna et al. 2014; Lin et al. 2016, 2022; Dvornik et al. 2017; Oyarzún et al. 2022, 2024; Ortega-Martinez et al. 2025). See the review by Wechsler & Tinker (2018) on this topic.
Several works have suggested a relationship between the two-halo galactic conformity with the galaxy assembly bias as a potential manifestation of the large-scale environment on galaxies (e.g., Hearin et al. 2015, 2016; Berti et al. 2017; Paranjape et al. 2015; Lacerna et al. 2018; Mansfield & Kravtsov 2020; Montero-Dorta et al. 2020; Hadzhiyska et al. 2023; Damsted et al. 2024; Garcia-Quintero et al. 2025; McConachie et al. 2025). By using mock catalogs from the Bolshoi simulation, Hearin et al. (2015) scrambled the star formation rate (SFR) of satellite galaxies, which only marginally influenced the two-halo conformity signal on central galaxies out to ∼5 h−1 Mpc. They concluded that the conformity signal is driven by galaxy assembly bias on central galaxies. In contrast, Zu & Mandelbaum (2018) used a “tunable” HOD to show that galactic conformity can be naturally explained by the combination of halo quenching and the variation of the halo mass function with the environment, without the need for any galaxy assembly bias. Paranjape et al. (2015) argued from extended HOD models that it is only at separations larger than 8 Mpc that one can find genuine two-halo conformity driven by the assembly bias of small host halos.
It is tempting to argue that since the conformity signal is typically limited to smaller scales, it would not correspond to assembly bias in principle. However, Hadzhiyska et al. (2023) conjectured that the galaxy formation process of emission-line galaxies (ELGs) could be dependent on the presence of nearby massive clusters, which, in turn, is connected to the two-halo conformity. In their study, these authors used ELGs extracted from the MillenniumTNG cosmological hydrodynamical simulation. It is possible that the level of assembly bias shown by ELGs in this simulation could be influenced by the conformity produced by nearby massive halos.
An explicit effort to assess the actual level of equivalence between galactic (or galaxy) conformity and assembly bias ought to be undertaken, since environmental effects in the vicinity of galaxy groups and clusters could be the cause of these two apparently different phenomena. For instance, Lacerna & Padilla (2011) claimed that assembly bias of low-mass systems can be explained by old, small structures located near massive halos that are typically at distances of a few Mpc. These massive halos could disrupt the growth of near-small objects via some specific mechanism (e.g., tidal stripping, Hahn et al. 2009), thereby affecting their properties, such as halo mass and formation time. There are similar concepts, such as “arrested development” (Dalal et al. 2008; Salcedo et al. 2018; Smith et al. 2024) or “neighbor bias”, where the mean value of halo properties depends (besides the halo mass) on the distance to a massive neighbor and the ratio of that neighbor’s mass to the halo mass (Salcedo et al. 2018).
This work is aimed at making such an effort and explicitly looking at the level of equivalence between conformity and assembly bias at large scales. For this purpose, we used the MDPL2-SAG catalog to select central galaxies near massive halos that mostly produce the two-halo conformity in the low-mass regime. We studied their direct contribution to the assembly-type bias signal. To avoid confusion with other definitions, we have chosen to use the term “assembly-type bias” here to refer to the secondary halo bias reflected in the clustering of central galaxies. The paper is organized as follows. Section 2 describes the synthetic galaxy catalog used in this work. The analysis of the two-halo galactic conformity is shown in Section 3, whereas the results on the assembly-type bias are shown in Section 4. We discuss our results and present our conclusions in Section 5.
Throughout this paper, the reduced Hubble constant, h, is defined as H0 = 100 h km s−1 Mpc−1. We opted to scale h explicitly throughout this work, with the following dependencies: stellar mass and halo mass in h−1 M⊙, physical scale in h−1 Mpc, and sSFR in h yr−1.
2. The MDPL2-SAG galaxy catalog
We used the MDPL2-SAG galaxy catalog, which was constructed by combining the semi-analytic model of galaxy formation SAG (Cora et al. 2018) with the dark matter (DM) only MultiDark Planck 2 (MDPL2) cosmological simulation (Klypin et al. 2016; Knebe et al. 2018). The SAG code includes the contribution of several physical processes, such as radiative gas cooling, quiescent star formation, starbursts triggered by mergers and disc instabilities, active galactic nuclei (AGNs) and supernova (SN) Type Ia and II feedback, and chemical enrichment. The DM simulation assumes a ΛCDM cosmology with Ωm = 0.307, ΩΛ = 0.693, ΩB = 0.048, ns = 0.96, and H0 = 100 h−1 km s−1 Mpc−1, where h = 0.678 (Planck Collaboration XVI 2014), tracing the evolution of 38403 particles from z = 120 to z = 0 in a box of side length 1 h−1 Gpc.
The ROCKSTAR halo finder (Behroozi et al. 2013) was used to identify DM halos and their substructures. This algorithm is phase-space-based, searching for overdensities in the particle distribution in both position and velocity space, using a linking length of b = 0.28, which guarantees that the virial spherical overdensities can be determined for even the most ellipsoidal halos. In this context, any overdensities should comprise at least 20 DM particles. According to the selection criteria, central galaxies are identified as galaxies residing in the center of the potential well of host halos. These main structures can host multiple substructures called subhalos, where satellite galaxies reside.
The MDPL2-SAG datasets can be found in the COSMOSIM database3. From the public catalog, we used the positions, star formation rate (parameter: sfr), the stellar mass as the sum of the mass of stars in the spheroid or bulge and the disk (parameters: mstarspheroid and mstardisk, respectively), and the stellar age (parameter: meanagestars), which is the mean age of the stellar population. For the host halo mass (Mh), we used the halomass parameter, which is the DM halo mass within a radius that contains a mean overdensity of 200 times the critical density of the Universe.
We focused on central galaxies at z = 0 hosted by low-mass halos of 1011.6 ≤ Mh/h−1 M⊙ < 1011.8. The idea behind this selection is that all the analysis in the paper is at a fixed halo mass where the assembly bias is strong (e.g., Gao et al. 2005; Li et al. 2008; Lacerna & Padilla 2011; Wechsler & Tinker 2018). The following section shows that these central galaxies show a remarkable signal of galactic conformity at large scales.
3. Two-halo galactic conformity
We measured the mean quenched fraction, fQ, of neighboring (secondary) galaxies around central (primary) galaxies at a fixed halo mass to assess the galactic conformity at z = 0. We used neighbor galaxies (either centrals or satellites) with stellar mass above 109 h−1 M⊙. This lower stellar mass limit has been used in other works with the MDPL2-SAG catalog to avoid resolution effects (e.g., Lacerna et al. 2022; Hough et al. 2023; Palma et al. 2025). We refer to the fiducial primary sample with all the central galaxies at fixed halo mass as “PrimAll”. We removed central galaxies in the vicinity of massive systems of Mh ≥ 1013 h−1 M⊙ out to 5 h−1 Mpc to define a primary sample away from massive halos. These are the same samples used by Lacerna et al. (2022), who chose this particular scale as a simple representation of the large-scale environment beyond the virial radius of host halos (e.g., Kuutma et al. 2017; Argudo-Fernández et al. 2018). We refer to this additional sample that does not include central galaxies around massive systems as “PrimB”. Table 1 lists the respective samples and criteria. We verified that the stellar mass distribution is very similar between the two parent samples and that the stellar mass-halo mass relation is relatively flat with halo mass, with an increase in stellar mass of 0.23 dex, which is expected given the narrow halo mass range of 0.2 dex.
Description and number of galaxies of the parent samples from MDPL2-SAG.
We separated the galaxies into quenched (Q) and star-forming (SF) galaxies at z = 0. We consider the same sSFR cut used in Lacerna et al. (2022) and Palma et al. (2025) to split the samples. A galaxy is considered quenched if sSFR ≤ 10−10.5 h yr−1. Otherwise, the galaxy is deemed to be star forming. This cut4 is chosen because it reproduces well the bimodality of galaxies in the MDPL2-SAG model, as shown in previous studies such as Brown et al. (2017) and Cora et al. (2018). We obtained a fraction of quenched galaxies of about 21% from the full catalog. This selection criterion was also applied to the low-mass central galaxies. Table 2 lists the information of the sub-samples of Q and SF central (primary) galaxies for the PrimAll and PrimB cases. Figure 1 shows the distribution of sSFR as a function of stellar age for the low-mass central galaxies. The right-hand panel shows that the parent samples PrimAll (solid black histogram) and PrimB (open gray histogram) exhibit very similar sSFR distributions. Their median values of log10(sSFR/h yr−1) are −9.59 and −9.57, respectively.
Description and number of sub-samples of central (primary) galaxies for each parent sample.
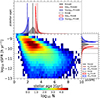 |
Fig. 1. Distribution of sSFR as a function of stellar age for the low-mass central galaxies, represented by the number density of galaxies as indicated in the color bar (main panel). The horizontal dotted line shows the condition used to separate star-forming and quenched galaxies. The top and the right panels show the normalized density distributions of stellar age and sSFR, respectively, for the parent samples and sub-samples as indicated in the legends and described in Tables 1 and 2. The integral of each histogram sums to unity. The lines correspond to the median value for the PrimAll (solid) and PrimB (dashed) samples. |
Figure 2 shows the mean quenched fraction of neighbor galaxies around central galaxies hosted by dark matter halos with masses between 1011.6 and 1011.8 h−1 M⊙. This figure is similar to that presented in Lacerna et al. (2022) and is also shown in this work for self-consistency. The dark red solid line and navy blue solid circles correspond to fQ around quenched and star-forming central galaxies in the primary PrimAll sample, respectively. The red dashed line and blue open circles respectively show the result after removing the quenched and star-forming central galaxies in the vicinity of halos more massive than 1013 h−1 M⊙ from the primary sample, PrimB case. The errors in the estimation of the mean fractions are calculated using 120 jackknifes (e.g., Zehavi et al. 2002; Norberg et al. 2009). Error bars in the mean fractions are estimated by using the diagonal of the covariance matrix. Given the large number of galaxies, the error bars are small enough to be imperceptible in the figure.
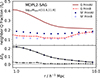 |
Fig. 2. Mean quenched fractions of neighboring galaxies (fQ) as functions of the real-space distance from primary galaxies hosted by low-mass halos of 1011.6 ≤ Mh/h−1 M⊙ < 1011.8 (main panel). The primary samples are separated by their sSFR. The fQ is shown around quenched and star-forming PrimAll galaxies as a dark red solid line and navy blue solid circles, respectively. The red dashed line and blue open circles correspond, respectively, to the mean fractions after removing the quenched and star-forming primary galaxies in the vicinity of halos more massive than 1013 h−1 M⊙, i.e, the PrimB case. The lower sub-panel shows the difference in the mean quenched fractions of neighboring galaxies around quenched and star-forming primary galaxies at fixed halo mass. The solid line shows the PrimAll case, whereas the dashed line is the result obtained for PrimB. The dotted line denotes the case of zero difference, namely, where there is no conformity. |
The lower sub-panel of Fig. 2 shows the two-halo conformity signal for the two cases, measured as the difference of the mean quenched fractions of neighboring galaxies around Q and SF primary galaxies (ΔfQ) at fixed halo mass. The signal is strong in the fiducial case (solid line), where the fraction of quenched neighbor galaxies at distances of ∼1 h−1 Mpc from primary galaxies is much higher around quenched centrals than around star-forming centrals, with ΔfQ = 0.22. This correlation decreases with distance from the central galaxies, becoming quite low at distances r ≳ 6 h−1 Mpc with ΔfQ ≲ 0.04. In contrast, the two-halo conformity signal of the PrimB case (dashed line) is always very low at distances r ≳ 1 h−1 Mpc with ΔfQ ≲ 0.02. As shown by Lacerna et al. (2022), this result is not an artifact of removing galaxies from the primary sample. The low-mass central galaxies in the vicinity of galaxy groups and clusters are responsible for the majority of the conformity signal at Mpc scales. They display a larger neighborhood quenched fraction than other centrals since, when removing these, the fQ is also lower. In the next section, we study their potential contribution to the assembly-type bias.
4. Assembly-type bias
In this section, we explore the contribution of low-mass central galaxies around massive groups and clusters to the assembly-type bias signal. As shown in the previous section, central galaxies hosted by low-mass halos near massive halos can greatly explain most of the two-halo conformity signal. Similarly to that approach, we first measure the two-point correlation functions for the fiducial PrimAll case and then for the PrimB case that excludes the low-mass central galaxies in the vicinity of massive structures.
We used the CORRFUNC software (Sinha & Garrison 2017, 2019, 2020) to measure the two-point correlation functions using the Landy-Szalay estimator (Landy & Szalay 1993). Given the geometrical effect of removing galaxies out to cluster-centric distances of 5 h−1 Mpc, we constructed a random catalog for the PrimB case that considers this effect. First, we created a fiducial random catalog within the simulation box that is three times the number of primary galaxies, producing a catalog of ∼8 200 000 random objects. Then, we used the positions of groups and clusters in the simulation to remove the random points at cluster-centric distances of ≤5 h−1 Mpc in real space. The random catalog of the PrimB case is made up of the remaining random points (about ∼7 000 000 objects). The error bars in the clustering estimations of this section are calculated using the diagonal of the covariance matrix from the bootstrap method (e.g., Norberg et al. 2009) by randomly resampling each galaxy sample 25 times with replacement.
4.1. Quenched and star-forming samples for a defined cut in sSFR
The aim of this subsection is to assess the contribution of the galaxies that produce the two-halo conformity to the assembly-type bias signal using the same conditions of Section 3, namely, we estimated the two-point correlation functions for the samples of quenched and star-forming primary galaxies defined in the previous section using a cut in sSFR of 10−10.5 h yr−1. Given the low-mass regime of Mh between 1011.6 and 1011.8 h−1 M⊙, the fraction of SF central galaxies is much higher than the fraction of Q central galaxies with the same host halo mass (98.5% and 1.5%, respectively, see Table 2). Section 4.2 gives the results for samples with the same number of quenched and star-forming central galaxies.
4.1.1. The fiducial PrimAll case
Figure 3 shows the two-point cross-correlation functions between the quenched primary galaxies and the full sample of primary galaxies (dark red solid line) and between star-forming primary galaxies and the full sample of primary galaxies (navy blue solid circles) in the PrimAll case. They correspond to the fiducial case of central galaxies hosted by low-mass dark matter halos between Mh = 1011.6 and 1011.8 h−1 M⊙. The overall clustering of central galaxies is expected to be dominated by star-forming galaxies because they correspond to the majority of the centrals in the halo mass range explored in this paper. This behavior is demonstrated when we show the autocorrelation function of all the primary galaxies in the fiducial case as a black solid line, with a clustering almost the same as the cross-correlation of the SF primaries (navy blue circles). On the other hand, the clustering of quenched central galaxies is higher than that of star-forming centrals hosted by halos of the same mass. This result is also seen in the solid lines of the bottom panel, which shows the ratio between the correlation function of quenched centrals and the total population (dark red solid line) and between the star-forming centrals and the total population (navy blue solid circles) of the fiducial case. The ratio is a factor of more than 2 for the quenched central galaxies out to 50 h−1 Mpc, which implies a strong secondary bias on this population because the galaxy clustering depends on the sSFR at fixed halo mass.
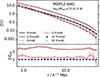 |
Fig. 3. Two-point correlation functions of primary galaxies hosted by dark matter halos with masses of 1011.6 ≤ Mh/h−1 M⊙ < 1011.8. The autocorrelation function for the case with all the central galaxies in the primary sample (PrimAll) is shown as a solid black line, whereas the dark red solid line and navy blue circles correspond to the cross-correlation functions of quenched and star-forming primary galaxies, respectively. On the other hand, the dashed gray line corresponds to the autocorrelation function after removing the central galaxies in the vicinity of halos more massive than 1013 h−1 M⊙ from the primary sample (PrimB case). The red dashed line and open blue circles correspond to the cross-correlation functions of quenched and star-forming primary galaxies in the PrimB case, respectively. The dashed lines and open circles are then the results after removing the galaxies that mostly contribute to the two-halo galactic conformity. The sub-panel shows the ratio between the correlation function of each sub-sample and the respective parent sample. The solid and dashed lines are for the cases Q PrimAll and Q PrimB, respectively. The solid and open circles are for the cases SF PrimAll and SF PrimB, respectively. There is an overlap in the circles because both ratios are close to unity. |
4.1.2. The PrimB case
In Section 3, we mentioned the significant contribution of central galaxies in the vicinity of massive halos in the two-halo galactic conformity signal. To assess the contribution of these galaxies in the fiducial signal of the assembly-type bias shown in Section 4.1.1, we repeated the process of removing those galaxies from the primary sample (i.e., we estimate the two-point correlation functions for the PrimB case). The cross-correlation function between the quenched (star-forming) primary galaxies and the primary galaxies for this case is shown as a red dashed line (blue open circles) in the main panel of Fig. 3. The autocorrelation function of the primary galaxies of the PrimB case is shown as a gray dashed line. Star-forming galaxies still dominate the overall clustering of central galaxies because they correspond to 99.5% of the centrals in this case (see Table 2).
One difference compared with the fiducial case is that the clustering decreases for the quenched and star-forming populations, even when the halo mass range is the same, probably due to the removal of galaxies in the vicinities of massive halos. Furthermore, the difference in the clustering between the quenched and star-forming galaxies of the same halo mass is remarkably reduced, which is also shown by the correlation function ratios in the bottom panel of the figure in red dashed line and blue open circles. The average ratio in the two-halo regime between 1 and 50 h−1 Mpc is 1.28 for the quenched central galaxies, which is a decrease of about five times in the relative assembly-type bias on this population when low-mass central galaxies near massive systems are not considered in the clustering estimations.
4.2. Equal samples of quenched and star-forming central galaxies
The results presented in Section 4.1 are strongly weighted by the dominant number of central galaxies in the star-forming samples compared to the quenched samples. One may argue that comparing the cross-correlations between both samples is not “fair” due to the differences in number. Studies of assembly bias typically use samples of similar or equal numbers of halos or galaxies in the extremes of the distributions of secondary parameters. To evaluate the consistency of the results of Section 4.1 with the literature, we used 10% of the most quenched central galaxies (Q10) and the 10% of the most star-forming central galaxies (SF10) in the halo mass range of 1011.6 and 1011.8 h−1 M⊙. In this way, we have the same number of central galaxies in both samples, including and excluding galaxies close to massive halos. There are 273 655 quenched central galaxies and the same number of star-forming centrals in the PrimAll case, while this number decreases to 169 781 central galaxies for each sample of quenched and star-forming galaxies in the PrimB case (see Table 2). As well as the case of the parent samples, the fraction of central galaxies with sSFR ≤ 10−10.5 is higher for the Q10 PrimAll sub-sample than the Q10 PrimB, with quenched fractions of 0.15 and 0.05, respectively. This result is in agreement with Palma et al. (2025), who find a larger number of quenched central galaxies near massive halos than in the field at fixed stellar mass because PrimB samples correspond to “field” central galaxies, whereas PrimAll samples include central galaxies near massive groups and clusters.
The top-left panel of Fig. 4 shows the cross-correlation functions of these sub-samples for the cases PrimAll and PrimB. The autocorrelations of the parent samples are also shown, which are the same as Fig. 3, by definition, and we used the same symbols and line styles as in that figure. It is now clear the separation in the clustering of both the most quenched and the most star-forming central galaxies with respect to the autocorrelation function of all the central galaxies at a fixed halo mass in the PrimAll case (i.e., an assembly-type bias) with a higher and lower clustering, respectively, as also shown in the solid line and solid circles in the sub-panel of the figure. This behavior is due to the high star formation sample including fewer SF galaxies than in the previous case, but also with slightly higher sSFRs, on average, and the least star-forming counterpart containing the quiescent galaxies of Section 4.1. The clustering of the 10% most quenched galaxies is, on average, about 50% higher than all the central galaxies between 1 and 50 h−1 Mpc, whereas it is about 25% lower for the most star-forming central galaxies.
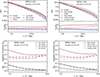 |
Fig. 4. Top-left: Same as Fig. 3, but the cross-correlations are between the most quenched or the 10% of the most star-forming central galaxies and the respective parent sample of primary galaxies. Top-right: Cross-correlations between the oldest or youngest central galaxies and the respective parent sample of primary galaxies. Bottom: Same as Fig. 2, but the primary samples are separated between the 10% of the most quenched and the 10% of the most star-forming central galaxies (left) and between the 10% of the oldest and 10% of the youngest central galaxies (right). |
When central galaxies in the vicinity of galaxy groups and clusters were not used in the estimations, the clustering of the most quenched galaxies was about 15% higher, whereas it was 10% lower for the most star-forming galaxies (on average) between 1 and 50 h−1 Mpc with respect to all the central galaxies in the PrimB case. The above means a decrease of a factor of three in the relative assembly-type bias for equal samples of quenched and star-forming central galaxies. We notice a slight increase in the ratios of PrimB galaxies at scales above ∼10 h−1 Mpc. We come back to this further below.
We confirmed that the distributions for the respective quenched and star-forming sub-samples are similar between the cases PrimAll and PrimB (see the right-hand panel of Fig. 1). The median log10(sSFR/h yr−1) is −10.00 (−9.29) and −9.91 (−9.27) for 10% of the most Q (SF) centrals in the PrimAll and PrimB samples, respectively. Therefore, the differences in the clustering between the PrimAll and PrimB are not due to different sSFR of the chosen quenched and star-forming samples.
The assembly-type bias is strongly reduced in the PrimB case when separating the samples according to their sSFR. We observed a similar decrease in the two-halo conformity signal using these sub-samples of primary galaxies. The bottom-left panel of Fig. 4 shows the mean quenched fractions of neighboring galaxies around primary galaxies separated for the 10% of the most quenched (Q10) and the 10% of the most star-forming (SF10) central galaxies in the same host halo mass range. In this way, we can assess whether the conformity signal varies in the same manner as the assembly-type bias signal under these conditions. We maintain the definition that secondary galaxies are quenched if sSFR ≤ 10−10.5 h yr−1. The quenched fractions of neighboring (secondary) galaxies decrease around primary galaxies in the PrimAll case (dark red solid line and navy blue solid circles) compared to the results in Fig. 2. The conformity signal (black solid line) also decreases from ΔfQ = 0.22 to 0.15 at separations of r ∼ 1 h−1 Mpc, but it is relatively strong out to distances r ≲ 4 h−1 Mpc with ΔfQ > 0.04. This lower signal is expected because 10% of the most quenched primary galaxies include centrals with sSFR > 10−10.5 h yr−1. On the other hand, the conformity signal for the case PrimB (black dashed line) is similar to that shown in Fig. 2, although with slightly higher values of ΔfQ ∼ 0.03 at separations between 1 and 1.5 h−1 Mpc.
When studying conformity using the exact percentiles in sSFR, the conformity signal for the fiducial case is also present, but diminished with respect to using quenched and star-forming samples. It seems that low-mass central galaxies in the vicinity of groups and clusters, responsible for the “standard” two-halo conformity, might be able to explain the assembly-type bias partially, but not all of it. The following section studies the signal strength based on another galaxy property: the stellar age.
4.3. Separating samples of central galaxies according to their stellar ages
We have shown that central galaxies responsible for the two-halo conformity in the low-mass regime can mostly account for the assembly-type bias signal at separations of a few dozen Mpc. The signals measured in Figs. 3 and 4 (top-left panels) were estimated after separating the sample of central galaxies at fixed halo mass according to their sSFR. However, the sSFR might not be the best tracer of the host halo formation time, a secondary halo property that exhibits strong assembly bias in low-mass DM halos, since it quantifies the level of recent star formation in galaxies.
As suggested by Lacerna & Padilla (2011), a better observational tracer for the halo formation time at fixed halo mass is the stellar age. Therefore, in this section, we measure the signal of assembly-type bias for the fiducial PrimAll case and the case without central galaxies in the vicinity of massive structures PrimB using the stellar age of the central galaxies. For each case, we separated the 10% of the oldest and the 10% of the youngest galaxies (see Table 2). The correlation functions are shown in the top-right panels of Fig. 4. The difference in clustering between the oldest and youngest galaxies in the fiducial case (dark red solid line and navy blue solid circles) is much stronger than between the most quenched and star-forming galaxies (top-left panels of Fig. 4), which confirms that the stellar age is a better proxy for the halo formation time than the sSFR. The clustering of the oldest galaxies is, on average, about two times higher than for the case of all the central galaxies between 1 and 50 h−1 Mpc; whereas it is about 30% lower for the youngest central galaxies. In the PrimB case (dashed lines and open circles), the clustering between the oldest and youngest galaxies drastically reduces between 1 and ∼10 h−1 Mpc by a factor of ∼4. However, the assembly-type bias becomes stronger at larger separations in a clearer way than we found for samples separated according to their sSFR. We focus on a possible explanation for this in the following subsection.
We confirmed that the two-halo conformity signal using these sub-samples of primary galaxies also correlates with the assembly-type bias of the top-right panels of Fig. 4. The bottom-right panel of Fig. 4 shows the mean quenched fractions of neighboring galaxies around primary galaxies separated between the 10% oldest (Old10) and the 10% youngest (Young10) central galaxies in the same host halo mass range. The quenched fractions of neighboring galaxies also decrease with the distance from primary galaxies in the PrimAll case, compared to the results in Fig. 2. The conformity signal (black solid line) decreases from ΔfQ = 0.22 to 0.18 at separations of r ∼ 1 h−1 Mpc. It is relatively strong at distances r ≲ 7 h−1 Mpc with ΔfQ ≳ 0.04. Therefore, the conformity signal is stronger after separating the fiducial primary sample by stellar age than by sSFR. This result is consistent with the assembly-type bias, which is stronger when using the stellar age compared to when using the sSFR.
The conformity signal is notably reduced for the PrimB samples, but the residual signal is higher when separating for the stellar ages than for the sSFR. In contrast to the bottom-left panel of Fig. 4, the bottom-right panel shows an evident two-halo conformity signal for the PrimB case at separations of r ≲ 2 h−1 Mpc. This result is mainly produced by the higher quenched fraction of neighbors around the oldest primary galaxies (red dashed line). We notice that 10% of the oldest PrimB galaxies have a median stellar age of 3.3 Gyr (see the red dashed line in the top panel of Fig. 1), which also include many star-forming galaxies with sSFR > 10−10.5 h yr−1, which are not part of the 10% of the most quenched galaxies. Nonetheless, the conformity signal decreases notably in the PrimB case compared to the fiducial PrimAll case at r ≥ 1 h−1 Mpc.
We checked whether the change in clustering could possibly be due to a substantial change in the stellar age distributions of the oldest or youngest primary galaxies between the PrimAll and PrimB cases (see the top panel of Fig. 1). The median stellar age of the 10% of the oldest galaxies in PrimAll is 3.47 Gyr, whereas it is 3.26 Gyr in PrimB. When considering the 10% subsample of the youngest central galaxies, the median age is 1.98 Gyr in PrimAll, whereas it is 1.93 Gyr in PrimB. The stellar ages are slightly younger when the central galaxies in the vicinity of massive structures are not considered compared with the fiducial case, but not more than 200 Myr on average. This result shows that the different amplitudes of assembly bias between the PrimAll and PrimB are not due to the difference in stellar age of the chosen old and young subsamples.
4.4. Effects of removing galaxies around massive halos
We found that the low-mass central galaxies in the vicinity of massive galaxy groups and clusters have, in addition to their contribution to the two-halo galactic conformity, an important role in the assembly-type bias of central galaxies at fixed halo mass at a separation of dozens of Mpc. The signal of assembly-type bias decreases by a factor of three to four if they are not included in the clustering estimations (PrimB case), with a possible slight increase around 10 h−1 Mpc. In particular, the results of the top-right panel of Fig. 4, when separating between the 10% of the oldest and the 10% of the youngest galaxies, show the most noticeable increase in the signal at these large separations, reaching a clustering similar to the fiducial case (PrimAll) at r > 50 h−1 Mpc within the error bars.
The PrimB case is based on removing central galaxies near massive halos out to cluster-centric distances of 5 h−1 Mpc. It is also of interest to check whether there is a particular set of scales in which the clustering of the remaining central galaxies is affected by the massive halos located at the center of the removed regions. To quantify the impact on the selection of this region, we randomly moved the position of dark matter halos with masses Mh ≥ 1013 h−1 M⊙ by a fixed distance of 5 h−1 Mpc from the original positions. We then estimated the cross-correlation function between the PrimB sample and the massive halos with the original and the new halo positions. The result is shown in Fig. 5. The clustering with the original and random positions of massive halos (gray dashed and green dot-dashed lines, respectively) differs at separations smaller than 10 h−1 Mpc, with the clustering of the sample with displaced halos being lower than the original one, until they tend to similar amplitudes at separations larger than 10 h−1 Mpc. This is the same scale on which we observe an increase in the assembly-type bias strength in the PrimB case.
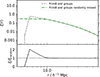 |
Fig. 5. Cross-correlation function between the “PrimB” sample and the groups and clusters with masses above 1013 h−1 M⊙ (gray dashed line). The green dot-dashed line corresponds to the cross-correlation that uses random positions of massive halos with a vector of 5 h−1 Mpc length from the original positions. The sub-panel shows the ratio between the correlation functions using the original and random positions of massive halos. They are the same at scales larger than 10 h−1 Mpc. |
The same clustering at separations larger than 10 h−1 Mpc, regardless of the exact position of massive halos, means that there is a large-scale correlation with them that is still present in the correlation function even when massive halos are moved to a distance of 5 h−1 Mpc from their original positions. Therefore, although the short-range effect of assembly-type bias is removed in PrimB, there is still an excess of clustering due to the presence of massive halos at larger scales contributing to the signal. The increase of the assembly-type bias signal at large separations is less clearly seen in the case where samples are divided according to their sSFR; however, in these cases, the error bars are large at large separations.
It is interesting to note that this type of selection could produce a scale-dependent bias. It is possible that some galaxy selections targeting, for instance, samples of emission-line galaxies, could be affected in a similar way. In particular, emission-line galaxies could avoid high-density regions dominated by quenched objects, but still be affected by modes produced by massive clusters of galaxies.
5. Discussion and conclusions
Environmental effects in the vicinity of massive galaxy groups and clusters seem to cause a significant fraction of two apparently different phenomena: two-halo galactic conformity and assembly-type bias. The former is a term used to describe the correlation between color or star formation activity in low-mass central galaxies and neighboring galaxies in adjacent halos at separations of several Mpc, whereas the latter is the secondary halo bias reflected in the large-scale clustering of central galaxies. We evaluated the actual level of equivalence between both phenomena using the MDPL2-SAG galaxy catalog constructed by combining the semi-analytic model of galaxy formation SAG with the dark matter-only MultiDark Planck 2 (MDPL2) cosmological simulation.
We focused on synthetic central galaxies at z = 0 hosted by low-mass halos of 1011.6 ≤ Mh/h−1 M⊙ < 1011.8 because it is a mass range where the assembly-type bias has been reported to be strong. We referred to the fiducial primary sample with all the central galaxies at fixed halo mass as PrimAll. We used an additional sample of primary galaxies away from massive halos referred to as PrimB, which does not include central galaxies around massive systems of Mh ≥ 1013 h−1 M⊙ out to a cluster-centric distance of 5 h−1 Mpc.
The mean fraction of quenched neighboring galaxies at distances between ∼1 and 6 h−1 Mpc from primary galaxies is much higher around quenched centrals than around star-forming centrals in the fiducial case, which implies a strong signal of conformity at fixed halo mass. In contrast, the two-halo conformity signal of the PrimB case is always very low at distances r ≳ 1 h−1 Mpc (Fig. 2). We measured the two-point cross-correlation functions for the fiducial case PrimAll and for the PrimB case, which excludes low-mass central galaxies in the vicinity of massive structures. The ratio between the correlation function of quenched PrimAll galaxies and the total population of central galaxies at fixed halo mass is a factor greater than 2, implying a strong secondary bias on this population. We found that the relative assembly-type bias decreases about five times, on average, between 1 and 50 h−1 Mpc when low-mass central galaxies near massive systems are not considered in the clustering estimations (Fig. 3). Therefore, both the galactic conformity and the assembly-type bias are strongly produced by quenched low-mass central galaxies nearmassive halos.
The fraction of quenched central galaxies is 1.5% in the halo mass regime studied (Table 2). When separating the samples of quenched and star-forming galaxies with the same fraction (10% in our case) as is usually done in the literature on the secondary bias, the relative assembly-type bias decreases about three times in the PrimB case compared to the fiducial PrimAll case (top-left panel of Fig. 4). Still, the PrimB case shows that the clustering of the most quenched galaxies is about 15% higher; whereas it is 10% lower for the most star-forming galaxies, on average between 1 and 50 h−1 Mpc with respect to all the central galaxies. Therefore, low-mass central galaxies in the vicinity of groups and clusters, responsible for the two-halo conformity, might be able to explain the assembly-type bias partially, but not all of it. When looking at the conformity signal for these sub-samples, we do find a strong conformity signal for PrimAll. Furthermore, after removing galaxies that are close to massive halos, the conformity signal between 1 and 1.5 h−1 Mpc decreases to a lesser extent than it does for the PrimB case shown in Fig. 2. We show the corresponding conformity signals in the bottom-left panel of Fig. 4. The higher two-halo conformity signal at those scales with the same fractions of Q and SF PrimB galaxies (subsamples Q10 and SF10) compared to the case separating between Q and SF galaxies resembles the higher assembly-type bias for the former than the latter.
We also separated the samples according to their stellar age because it has been proposed as an observational tracer for the halo formation time at fixed halo mass. We confirmed that the stellar age correlates with halo age in our model. For the PrimAll sample, older central galaxies tend to reside in halos formed early on (see Fig. A.1 in the appendix). We found that the difference in clustering between the oldest and youngest galaxies in the fiducial case (PrimAll, top-right panel of Fig. 4) is much stronger than the difference between the most quenched and star-forming central galaxies.
The clustering between the oldest and youngest galaxies drastically reduces by a factor of ∼4 between 1 and ∼10 h−1 Mpc in the PrimB case. However, the assembly-type bias becomes stronger at larger separations, reaching a clustering similar to the fiducial case at r > 50 h−1 Mpc. We quantified the impact of removing low-mass central galaxies near groups and clusters by randomly moving the position of massive halos by a fixed distance of 5 h−1 Mpc from their original positions. The cross-correlation function between the PrimB sample and the massive halos with their original and random positions becomes equal at separations larger than 10 h−1 Mpc (Fig. 5), which is the same scale with the increase in the assembly-type bias strength seen in the PrimB case. Therefore, there is an excess of clustering due to the presence of massive halos at scales larger than 10 h−1 Mpc, which contributes to the signal. Again, we repeated the measurement of the quenched fraction of neighboring galaxies as a function of distance for this set of primary samples and show the results in the bottom-right panel of Fig. 4. As can be seen, the signal of conformity around PrimAll and PrimB central galaxies with old and young stellar populations is higher than that of the selection of samples using sSFR, mirroring the relative amplitudes of assembly-type bias for these two sets of samples.
We confirmed that the MDPL2-SAG model is consistent with other models, such as the SIMBA simulation (Davé et al. 2019), in terms of the tendency of central galaxies with high stellar masses to reside in halos that formed early on at the same halo mass (Cui et al. 2021). However, in our model, the older central galaxies are typically hosted by halos that formed early on, which is different from Cui et al. (2021) or Wang et al. (2023b), whose models show that halos formed early on tend to host blue or star-forming galaxies. Wang et al. (2023b) showed that central galaxies in late-formed halos have higher fractions of quiescence by 2% to 8% than their counterparts that formed early on at halo masses higher than 1012.5 M⊙. This difference decreases for halos between 1012 and 1012.5 M⊙, which is the lowest mass range explored in that work. Therefore, we do not expect a large discrepancy in the stellar populations of central galaxies hosted by low-mass halos in all these models. In the low-mass regime, Wang & Peng (2025) showed that star-forming central galaxies tend to be more efficient at converting baryons into stars than quiescent central galaxies in the L-GALAXIES model (Henriques et al. 2015), while other models give similar efficiencies for these two populations. The stellar-mass-to-halo-mass ratios for both populations are usually within the error bars in all these models. The MDPL2-SAG model is more similar to ILLUSTRISTNG300 in this regard because in the same halo mass range, 10% of the most quiescent galaxies show a slightly higher stellar mass to halo mass ratio than the 10% of the most star-forming central galaxies; however, the ratios are within the error bars.
Wang et al. (2023b) show that SDSS central galaxies in halos that formed early on have higher fractions of star-forming galaxies. They use the residual tform with respect to their median as a function of halo mass to define the halo formation time, where tform is the lookback time when the halo has first assembled half of its final mass along the main branch. This definition is comparable to the δt dimensionless parameter introduced in Lacerna & Padilla (2011), where the residual with respect to the median formation time (or stellar age) is normalized by the dispersion around the median in units of time. Lacerna et al. (2014) used this dimensionless parameter and found that older SDSS central galaxies hosted by low-mass halos exhibit higher clustering than younger galaxies at a fixed halo mass, offering evidence of assembly-type bias.
The low-mass assembly-type bias can be explained by three causes, according to Mansfield & Kravtsov (2020): large-scale tidal fields, gravitational heating due to the collapse of large-scale structures, and splashback subhaloes located outside the virial radius. Palma et al. (2025) showed that the splashback galaxies do not affect the conformity signal in the MDPL2-SAG model. Therefore, it is likely that the correlation between conformity and low-mass assembly-type bias is mainly given by tidal forces and gravitational heating occurring in similar large-scale structures such as filaments. These two effects can truncate the mass accretion histories of low-mass halos (e.g., Mansfield & Kravtsov 2020).
Notably, the assembly-type bias we measured in this work is strongest for the fiducial samples, which also show the strongest conformity signal. This result suggests that there could exist a direct relation between the amplitude of these two effects. If two-halo conformity is confirmed with observational samples as shown, for example, by Ayromlou et al. (2023) using SDSS (Abazajian et al. 2009) and photo-z galaxies of the dark energy spectroscopic instrument (DESI, Dey et al. 2019; Zou et al. 2019) samples, it could be taken as an indication of assembly-type bias in the real Universe.
They used galaxies without relatively bright neighbors as the central galaxies.
Wang et al. (2023a) used the definition of main progenitors of central galaxies at present that were satellites of other halos for two successive snapshots.
Note: this corresponds to sSFR ∼ 10−10.7 yr−1 with h = 0.678, close to other cuts commonly used in the literature, e.g., 10−11 yr−1 (Wetzel et al. 2012).
Acknowledgments
The authors thank the anonymous referee for the revision that helped improve the presentation of this work. We would like to thank Antonio Montero-Dorta, Sergio Contreras, Vladimir Avila-Reese, Raúl Angulo, Aldo Rodríguez-Puebla, Simon White, Doris Stoppacher, and Nelvy Choque-Challapa for comments and discussions. We also thank Andrés Ruiz, Yamila Yaryura and Cristian Vega for their support in organizing and providing the MDPL2-SAG data used in this work. NP acknowledges support from Agencia Nacional de Investigación Científica y Tecnológica through grants PICT-2021-0700 and PICT-2023-0002. DP acknowledges the support through ANID-Subdirección de Capital Humano/Doctorado Nacional/2024/21241817. The CosmoSim database used in this paper is a service by the Leibniz-Institute for Astrophysics Potsdam (AIP). The MultiDark database was developed in cooperation with the Spanish MultiDark Consolider Project CSD2009-00064.
References
- Abazajian, K. N., Adelman-McCarthy, J. K., Agüeros, M. A., et al. 2009, ApJS, 182, 543 [Google Scholar]
- Alam, S., Peacock, J. A., Kraljic, K., Ross, A. J., & Comparat, J. 2020, MNRAS, 497, 581 [NASA ADS] [CrossRef] [Google Scholar]
- Argudo-Fernández, M., Lacerna, I., & Duarte Puertas, S. 2018, A&A, 620, A113 [NASA ADS] [CrossRef] [EDP Sciences] [Google Scholar]
- Artale, M. C., Zehavi, I., Contreras, S., & Norberg, P. 2018, MNRAS, 480, 3978 [NASA ADS] [CrossRef] [Google Scholar]
- Ayromlou, M., Kauffmann, G., Yates, R. M., Nelson, D., & White, S. D. M. 2021, MNRAS, 505, 492 [NASA ADS] [CrossRef] [Google Scholar]
- Ayromlou, M., Kauffmann, G., Anand, A., & White, S. D. M. 2023, MNRAS, 519, 1913 [Google Scholar]
- Bahé, Y. M., McCarthy, I. G., Balogh, M. L., & Font, A. S. 2013, MNRAS, 430, 3017 [Google Scholar]
- Bahé, Y. M., Barnes, D. J., Dalla Vecchia, C., et al. 2017, MNRAS, 470, 4186 [Google Scholar]
- Behroozi, P. S., Wechsler, R. H., & Wu, H.-Y. 2013, ApJ, 762, 109 [NASA ADS] [CrossRef] [Google Scholar]
- Benítez-Llambay, A., Navarro, J. F., Abadi, M. G., et al. 2013, ApJ, 763, L41 [Google Scholar]
- Berti, A. M., Coil, A. L., Behroozi, P. S., et al. 2017, ApJ, 834, 87 [NASA ADS] [CrossRef] [Google Scholar]
- Blanton, M. R., Schlegel, D. J., Strauss, M. A., et al. 2005, AJ, 129, 2562 [NASA ADS] [CrossRef] [Google Scholar]
- Bluck, A. F. L., Mendel, J. T., Ellison, S. L., et al. 2014, MNRAS, 441, 599 [NASA ADS] [CrossRef] [Google Scholar]
- Bray, A. D., Pillepich, A., Sales, L. V., et al. 2016, MNRAS, 455, 185 [NASA ADS] [CrossRef] [Google Scholar]
- Brown, T., Catinella, B., Cortese, L., et al. 2017, MNRAS, 466, 1275 [Google Scholar]
- Calderon, V. F., Berlind, A. A., & Sinha, M. 2018, MNRAS, 480, 2031 [Google Scholar]
- Campbell, D., van den Bosch, F. C., Hearin, A., et al. 2015, MNRAS, 452, 444 [NASA ADS] [CrossRef] [Google Scholar]
- Contreras, S., Zehavi, I., Padilla, N., et al. 2019, MNRAS, 484, 1133 [NASA ADS] [CrossRef] [Google Scholar]
- Cooper, M. C., Gallazzi, A., Newman, J. A., & Yan, R. 2010, MNRAS, 402, 1942 [NASA ADS] [CrossRef] [Google Scholar]
- Cora, S. A., Vega-Martínez, C. A., Hough, T., et al. 2018, MNRAS, 479, 2 [Google Scholar]
- Croton, D. J., Gao, L., & White, S. D. M. 2007, MNRAS, 374, 1303 [Google Scholar]
- Cui, W., Davé, R., Peacock, J. A., Anglés-Alcázar, D., & Yang, X. 2021, Nat. Astron., 5, 1069 [NASA ADS] [CrossRef] [Google Scholar]
- Cybulski, R., Yun, M. S., Fazio, G. G., & Gutermuth, R. A. 2014, MNRAS, 439, 3564 [NASA ADS] [CrossRef] [Google Scholar]
- Dalal, N., White, M., Bond, J. R., & Shirokov, A. 2008, ApJ, 687, 12 [NASA ADS] [CrossRef] [Google Scholar]
- Damsted, S., Finoguenov, A., Lietzen, H., et al. 2024, A&A, 690, A52 [NASA ADS] [CrossRef] [EDP Sciences] [Google Scholar]
- Davé, R., Anglés-Alcázar, D., Narayanan, D., et al. 2019, MNRAS, 486, 2827 [Google Scholar]
- Dey, A., Schlegel, D. J., Lang, D., et al. 2019, AJ, 157, 168 [Google Scholar]
- Duckworth, C., Tojeiro, R., Kraljic, K., et al. 2019, MNRAS, 483, 172 [Google Scholar]
- Dvornik, A., Cacciato, M., Kuijken, K., et al. 2017, MNRAS, 468, 3251 [Google Scholar]
- Gao, L., Springel, V., & White, S. D. M. 2005, MNRAS, 363, L66 [NASA ADS] [CrossRef] [Google Scholar]
- Garcia-Quintero, C., Mena-Fernández, J., Rocher, A., et al. 2025, JCAP, 2025, 132 [Google Scholar]
- Goddard, D., Thomas, D., Maraston, C., et al. 2017, MNRAS, 465, 688 [Google Scholar]
- Hadzhiyska, B., Eisenstein, D., Hernquist, L., et al. 2023, MNRAS, 524, 2507 [NASA ADS] [CrossRef] [Google Scholar]
- Hahn, O., Porciani, C., Dekel, A., & Carollo, C. M. 2009, MNRAS, 398, 1742 [CrossRef] [Google Scholar]
- Hearin, A. P., Watson, D. F., & van den Bosch, F. C. 2015, MNRAS, 452, 1958 [CrossRef] [Google Scholar]
- Hearin, A. P., Behroozi, P. S., & van den Bosch, F. C. 2016, MNRAS, 461, 2135 [Google Scholar]
- Henriques, B. M. B., White, S. D. M., Thomas, P. A., et al. 2015, MNRAS, 451, 2663 [Google Scholar]
- Hough, T., Cora, S. A., Haggar, R., et al. 2023, MNRAS, 518, 2398 [Google Scholar]
- Kauffmann, G. 2015, MNRAS, 454, 1840 [NASA ADS] [CrossRef] [Google Scholar]
- Kauffmann, G., Li, C., Zhang, W., & Weinmann, S. 2013, MNRAS, 430, 1447 [Google Scholar]
- Klypin, A., Yepes, G., Gottlöber, S., Prada, F., & Heß, S. 2016, MNRAS, 457, 4340 [Google Scholar]
- Knebe, A., Stoppacher, D., Prada, F., et al. 2018, MNRAS, 474, 5206 [Google Scholar]
- Kraljic, K., Pichon, C., Dubois, Y., et al. 2019, MNRAS, 483, 3227 [Google Scholar]
- Kuutma, T., Tamm, A., & Tempel, E. 2017, A&A, 600, L6 [NASA ADS] [CrossRef] [EDP Sciences] [Google Scholar]
- Lacerna, I., & Padilla, N. 2011, MNRAS, 412, 1283 [NASA ADS] [Google Scholar]
- Lacerna, I., Padilla, N., & Stasyszyn, F. 2014, MNRAS, 443, 3107 [NASA ADS] [CrossRef] [Google Scholar]
- Lacerna, I., Contreras, S., González, R. E., Padilla, N., & Gonzalez-Perez, V. 2018, MNRAS, 475, 1177 [CrossRef] [Google Scholar]
- Lacerna, I., Rodriguez, F., Montero-Dorta, A. D., et al. 2022, MNRAS, 513, 2271 [NASA ADS] [CrossRef] [Google Scholar]
- Landy, S. D., & Szalay, A. S. 1993, ApJ, 412, 64 [Google Scholar]
- Li, Y., Mo, H. J., & Gao, L. 2008, MNRAS, 389, 1419 [NASA ADS] [CrossRef] [Google Scholar]
- Li, L.-C., Qin, B., Wang, J., Wang, J., & Wang, Y.-G. 2021, RAA, 21, 032 [Google Scholar]
- Lin, Y.-T., Mandelbaum, R., Huang, Y.-H., et al. 2016, ApJ, 819, 119 [NASA ADS] [CrossRef] [Google Scholar]
- Lin, Y.-T., Miyatake, H., Guo, H., et al. 2022, A&A, 666, A97 [NASA ADS] [CrossRef] [EDP Sciences] [Google Scholar]
- Mansfield, P., & Kravtsov, A. V. 2020, MNRAS, 493, 4763 [NASA ADS] [CrossRef] [Google Scholar]
- Marinacci, F., Vogelsberger, M., Pakmor, R., et al. 2018, MNRAS, 480, 5113 [NASA ADS] [Google Scholar]
- McConachie, I., Wilson, G., Forrest, B., et al. 2025, ApJ, 978, 17 [Google Scholar]
- Montero-Dorta, A. D., Artale, M. C., Abramo, L. R., et al. 2020, MNRAS, 496, 1182 [NASA ADS] [CrossRef] [Google Scholar]
- Naiman, J. P., Pillepich, A., Springel, V., et al. 2018, MNRAS, 477, 1206 [Google Scholar]
- Nelson, D., Pillepich, A., Springel, V., et al. 2018, MNRAS, 475, 624 [Google Scholar]
- Nelson, D., Springel, V., Pillepich, A., et al. 2019, Comput. Astrophys. Cosmol., 6, 2 [Google Scholar]
- Norberg, P., Baugh, C. M., Gaztañaga, E., & Croton, D. J. 2009, MNRAS, 396, 19 [Google Scholar]
- Olsen, C., & Gawiser, E. 2023, ApJ, 943, 30 [Google Scholar]
- Ortega-Martinez, S., Contreras, S., Angulo, R. E., & Chaves-Montero, J. 2025, A&A, 697, A226 [NASA ADS] [CrossRef] [EDP Sciences] [Google Scholar]
- Oyarzún, G. A., Bundy, K., Westfall, K. B., et al. 2022, ApJ, 933, 88 [Google Scholar]
- Oyarzún, G. A., Tinker, J. L., Bundy, K., Xhakaj, E., & Wyithe, J. S. B. 2024, ApJ, 974, 29 [Google Scholar]
- Pallero, D., Gómez, F. A., Padilla, N. D., et al. 2019, MNRAS, 488, 847 [NASA ADS] [CrossRef] [Google Scholar]
- Palma, D., Lacerna, I., Artale, M. Celeste, et al. 2025, A&A, 693, A67 [NASA ADS] [CrossRef] [EDP Sciences] [Google Scholar]
- Pandey, B., & Sarkar, S. 2020, MNRAS, 498, 6069 [NASA ADS] [CrossRef] [Google Scholar]
- Paranjape, A., Kovač, K., Hartley, W. G., & Pahwa, I. 2015, MNRAS, 454, 3030 [Google Scholar]
- Peng, Y.-J., Lilly, S. J., Kovač, K., et al. 2010, ApJ, 721, 193 [Google Scholar]
- Pillepich, A., Springel, V., Nelson, D., et al. 2018, MNRAS, 473, 4077 [Google Scholar]
- Planck Collaboration XVI. 2014, A&A, 571, A16 [NASA ADS] [CrossRef] [EDP Sciences] [Google Scholar]
- Rafieferantsoa, M., & Davé, R. 2018, MNRAS, 475, 955 [Google Scholar]
- Salcedo, A. N., Maller, A. H., Berlind, A. A., et al. 2018, MNRAS, 475, 4411 [NASA ADS] [CrossRef] [Google Scholar]
- Sin, L. P. T., Lilly, S. J., & Henriques, B. M. B. 2017, MNRAS, 471, 1192 [Google Scholar]
- Sin, L. P. T., Lilly, S. J., & Henriques, B. M. B. 2019, MNRAS, 488, 234 [Google Scholar]
- Sinha, M., & Garrison, L. 2017, Astrophysics Source Code Library [record ascl:1703.003] [Google Scholar]
- Sinha, M., & Garrison, L. 2019, Software Challenges to Exascale Computing (Singapore: Springer Singapore), 3 [Google Scholar]
- Sinha, M., & Garrison, L. H. 2020, MNRAS, 491, 3022 [Google Scholar]
- Skibba, R., Sheth, R. K., Connolly, A. J., & Scranton, R. 2006, MNRAS, 369, 68 [NASA ADS] [CrossRef] [Google Scholar]
- Smith, W. J., Berlind, A. A., & Sinha, M. 2024, MNRAS, 535, 1426 [Google Scholar]
- Springel, V., Pakmor, R., Pillepich, A., et al. 2018, MNRAS, 475, 676 [Google Scholar]
- Sun, S., Guo, Q., Wang, L., et al. 2018, MNRAS, 477, 3136 [Google Scholar]
- Tinker, J. L., Hahn, C., Mao, Y.-Y., Wetzel, A. R., & Conroy, C. 2018, MNRAS, 477, 935 [Google Scholar]
- Tremmel, M., Quinn, T. R., Ricarte, A., et al. 2019, MNRAS, 483, 3336 [CrossRef] [Google Scholar]
- Treyer, M., Kraljic, K., Arnouts, S., et al. 2018, MNRAS, 477, 2684 [NASA ADS] [CrossRef] [Google Scholar]
- Wang, K., & Peng, Y. 2025, ApJ, 980, 233 [Google Scholar]
- Wang, L., De Lucia, G., & Weinmann, S. M. 2013a, MNRAS, 431, 600 [Google Scholar]
- Wang, L., Weinmann, S. M., De Lucia, G., & Yang, X. 2013b, MNRAS, 433, 515 [NASA ADS] [CrossRef] [Google Scholar]
- Wang, K., Peng, Y., & Chen, Y. 2023a, MNRAS, 523, 1268 [NASA ADS] [CrossRef] [Google Scholar]
- Wang, K., Chen, Y., Li, Q., & Yang, X. 2023b, MNRAS, 522, 3188 [Google Scholar]
- Wechsler, R. H., & Tinker, J. L. 2018, ARA&A, 56, 435 [NASA ADS] [CrossRef] [Google Scholar]
- Wetzel, A. R., Tinker, J. L., & Conroy, C. 2012, MNRAS, 424, 232 [NASA ADS] [CrossRef] [Google Scholar]
- York, D. G., Adelman, J., Anderson, J. E., et al. 2000, AJ, 120, 1579 [Google Scholar]
- Zehavi, I., Blanton, M. R., Frieman, J. A., et al. 2002, ApJ, 571, 172 [NASA ADS] [CrossRef] [Google Scholar]
- Zehavi, I., Contreras, S., Padilla, N., et al. 2018, ApJ, 853, 84 [NASA ADS] [CrossRef] [Google Scholar]
- Zhang, Y., Yang, X., & Guo, H. 2021, MNRAS, 507, 5320 [Google Scholar]
- Zheng, Z., Wang, H., Ge, J., et al. 2017, MNRAS, 465, 4572 [Google Scholar]
- Zheng, Z., Li, C., Mao, S., et al. 2019, ApJ, 873, 63 [NASA ADS] [CrossRef] [Google Scholar]
- Zinger, E., Dekel, A., Kravtsov, A. V., & Nagai, D. 2018, MNRAS, 475, 3654 [Google Scholar]
- Zou, H., Gao, J., Zhou, X., & Kong, X. 2019, ApJS, 242, 8 [Google Scholar]
- Zu, Y., & Mandelbaum, R. 2018, MNRAS, 476, 1637 [NASA ADS] [CrossRef] [Google Scholar]
Appendix A: Correlation between halo formation time and stellar age in MDPL2-SAG model
The stellar age has been suggested as a tracer for the halo formation time (e.g., Lacerna & Padilla 2011). Figure A.1 shows the correlation between stellar age for the PrimAll galaxies and the half-peak mass scale factor as a definition of halo formation time. For this definition of halo age, we used the parameter ‘halfmass_scale’ from the COSMOSIM database that is the scale factor at which the most massive progenitor reaches half of the peak mass (0.5 × Mpeak) over accretion history. The figure shows that in MDPL2-SAG older central galaxies, hosted by low-mass halos in the narrow range of 1011.6 ≤ Mh/h−1 M⊙ < 1011.8, tend to live in halos that formed early on.
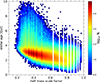 |
Fig. A.1. Stellar age as a function of halo formation time. For the latter, we used the scale factor at which the most massive progenitor reaches half of the peak mass (0.5 × Mpeak) over accretion history. The number density of PrimAll galaxies is indicated in the color bar. |
All Tables
Description and number of sub-samples of central (primary) galaxies for each parent sample.
All Figures
|
Fig. 1. Distribution of sSFR as a function of stellar age for the low-mass central galaxies, represented by the number density of galaxies as indicated in the color bar (main panel). The horizontal dotted line shows the condition used to separate star-forming and quenched galaxies. The top and the right panels show the normalized density distributions of stellar age and sSFR, respectively, for the parent samples and sub-samples as indicated in the legends and described in Tables 1 and 2. The integral of each histogram sums to unity. The lines correspond to the median value for the PrimAll (solid) and PrimB (dashed) samples. |
| In the text | |
|
Fig. 2. Mean quenched fractions of neighboring galaxies (fQ) as functions of the real-space distance from primary galaxies hosted by low-mass halos of 1011.6 ≤ Mh/h−1 M⊙ < 1011.8 (main panel). The primary samples are separated by their sSFR. The fQ is shown around quenched and star-forming PrimAll galaxies as a dark red solid line and navy blue solid circles, respectively. The red dashed line and blue open circles correspond, respectively, to the mean fractions after removing the quenched and star-forming primary galaxies in the vicinity of halos more massive than 1013 h−1 M⊙, i.e, the PrimB case. The lower sub-panel shows the difference in the mean quenched fractions of neighboring galaxies around quenched and star-forming primary galaxies at fixed halo mass. The solid line shows the PrimAll case, whereas the dashed line is the result obtained for PrimB. The dotted line denotes the case of zero difference, namely, where there is no conformity. |
| In the text | |
|
Fig. 3. Two-point correlation functions of primary galaxies hosted by dark matter halos with masses of 1011.6 ≤ Mh/h−1 M⊙ < 1011.8. The autocorrelation function for the case with all the central galaxies in the primary sample (PrimAll) is shown as a solid black line, whereas the dark red solid line and navy blue circles correspond to the cross-correlation functions of quenched and star-forming primary galaxies, respectively. On the other hand, the dashed gray line corresponds to the autocorrelation function after removing the central galaxies in the vicinity of halos more massive than 1013 h−1 M⊙ from the primary sample (PrimB case). The red dashed line and open blue circles correspond to the cross-correlation functions of quenched and star-forming primary galaxies in the PrimB case, respectively. The dashed lines and open circles are then the results after removing the galaxies that mostly contribute to the two-halo galactic conformity. The sub-panel shows the ratio between the correlation function of each sub-sample and the respective parent sample. The solid and dashed lines are for the cases Q PrimAll and Q PrimB, respectively. The solid and open circles are for the cases SF PrimAll and SF PrimB, respectively. There is an overlap in the circles because both ratios are close to unity. |
| In the text | |
|
Fig. 4. Top-left: Same as Fig. 3, but the cross-correlations are between the most quenched or the 10% of the most star-forming central galaxies and the respective parent sample of primary galaxies. Top-right: Cross-correlations between the oldest or youngest central galaxies and the respective parent sample of primary galaxies. Bottom: Same as Fig. 2, but the primary samples are separated between the 10% of the most quenched and the 10% of the most star-forming central galaxies (left) and between the 10% of the oldest and 10% of the youngest central galaxies (right). |
| In the text | |
|
Fig. 5. Cross-correlation function between the “PrimB” sample and the groups and clusters with masses above 1013 h−1 M⊙ (gray dashed line). The green dot-dashed line corresponds to the cross-correlation that uses random positions of massive halos with a vector of 5 h−1 Mpc length from the original positions. The sub-panel shows the ratio between the correlation functions using the original and random positions of massive halos. They are the same at scales larger than 10 h−1 Mpc. |
| In the text | |
|
Fig. A.1. Stellar age as a function of halo formation time. For the latter, we used the scale factor at which the most massive progenitor reaches half of the peak mass (0.5 × Mpeak) over accretion history. The number density of PrimAll galaxies is indicated in the color bar. |
| In the text | |
Current usage metrics show cumulative count of Article Views (full-text article views including HTML views, PDF and ePub downloads, according to the available data) and Abstracts Views on Vision4Press platform.
Data correspond to usage on the plateform after 2015. The current usage metrics is available 48-96 hours after online publication and is updated daily on week days.
Initial download of the metrics may take a while.