Fig. 4.
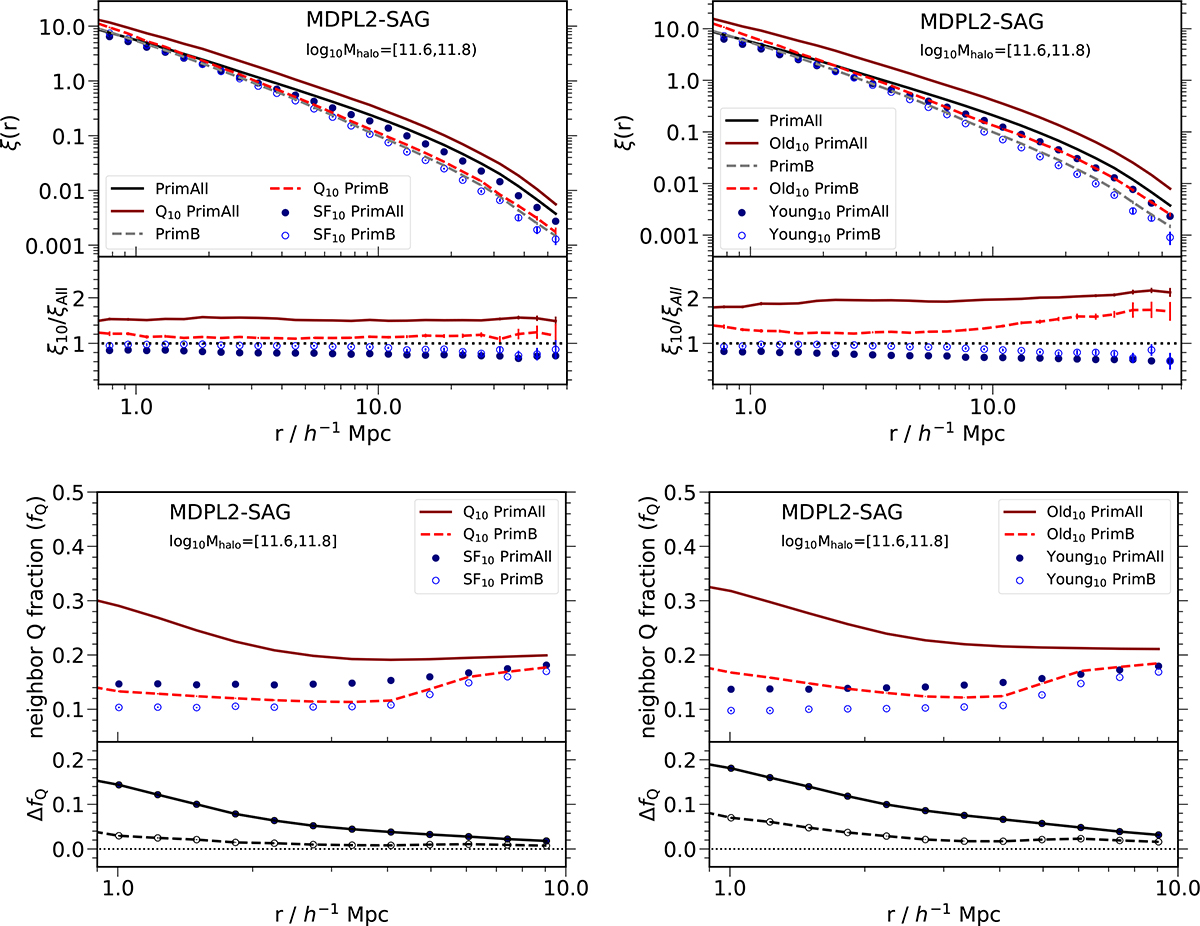
Download original image
Top-left: Same as Fig. 3, but the cross-correlations are between the most quenched or the 10% of the most star-forming central galaxies and the respective parent sample of primary galaxies. Top-right: Cross-correlations between the oldest or youngest central galaxies and the respective parent sample of primary galaxies. Bottom: Same as Fig. 2, but the primary samples are separated between the 10% of the most quenched and the 10% of the most star-forming central galaxies (left) and between the 10% of the oldest and 10% of the youngest central galaxies (right).
Current usage metrics show cumulative count of Article Views (full-text article views including HTML views, PDF and ePub downloads, according to the available data) and Abstracts Views on Vision4Press platform.
Data correspond to usage on the plateform after 2015. The current usage metrics is available 48-96 hours after online publication and is updated daily on week days.
Initial download of the metrics may take a while.