Fig. 5.
Download original image
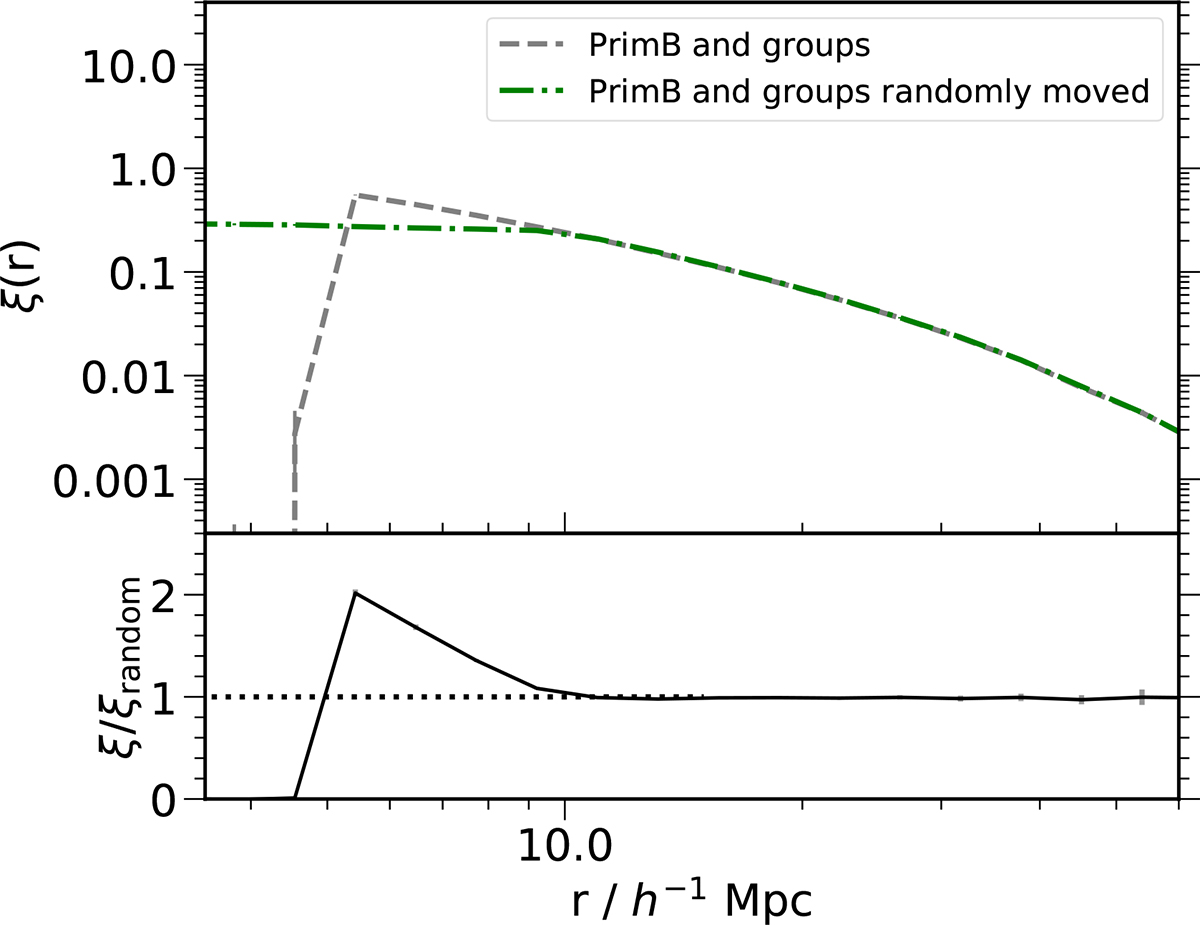
Cross-correlation function between the “PrimB” sample and the groups and clusters with masses above 1013 h−1 M⊙ (gray dashed line). The green dot-dashed line corresponds to the cross-correlation that uses random positions of massive halos with a vector of 5 h−1 Mpc length from the original positions. The sub-panel shows the ratio between the correlation functions using the original and random positions of massive halos. They are the same at scales larger than 10 h−1 Mpc.
Current usage metrics show cumulative count of Article Views (full-text article views including HTML views, PDF and ePub downloads, according to the available data) and Abstracts Views on Vision4Press platform.
Data correspond to usage on the plateform after 2015. The current usage metrics is available 48-96 hours after online publication and is updated daily on week days.
Initial download of the metrics may take a while.