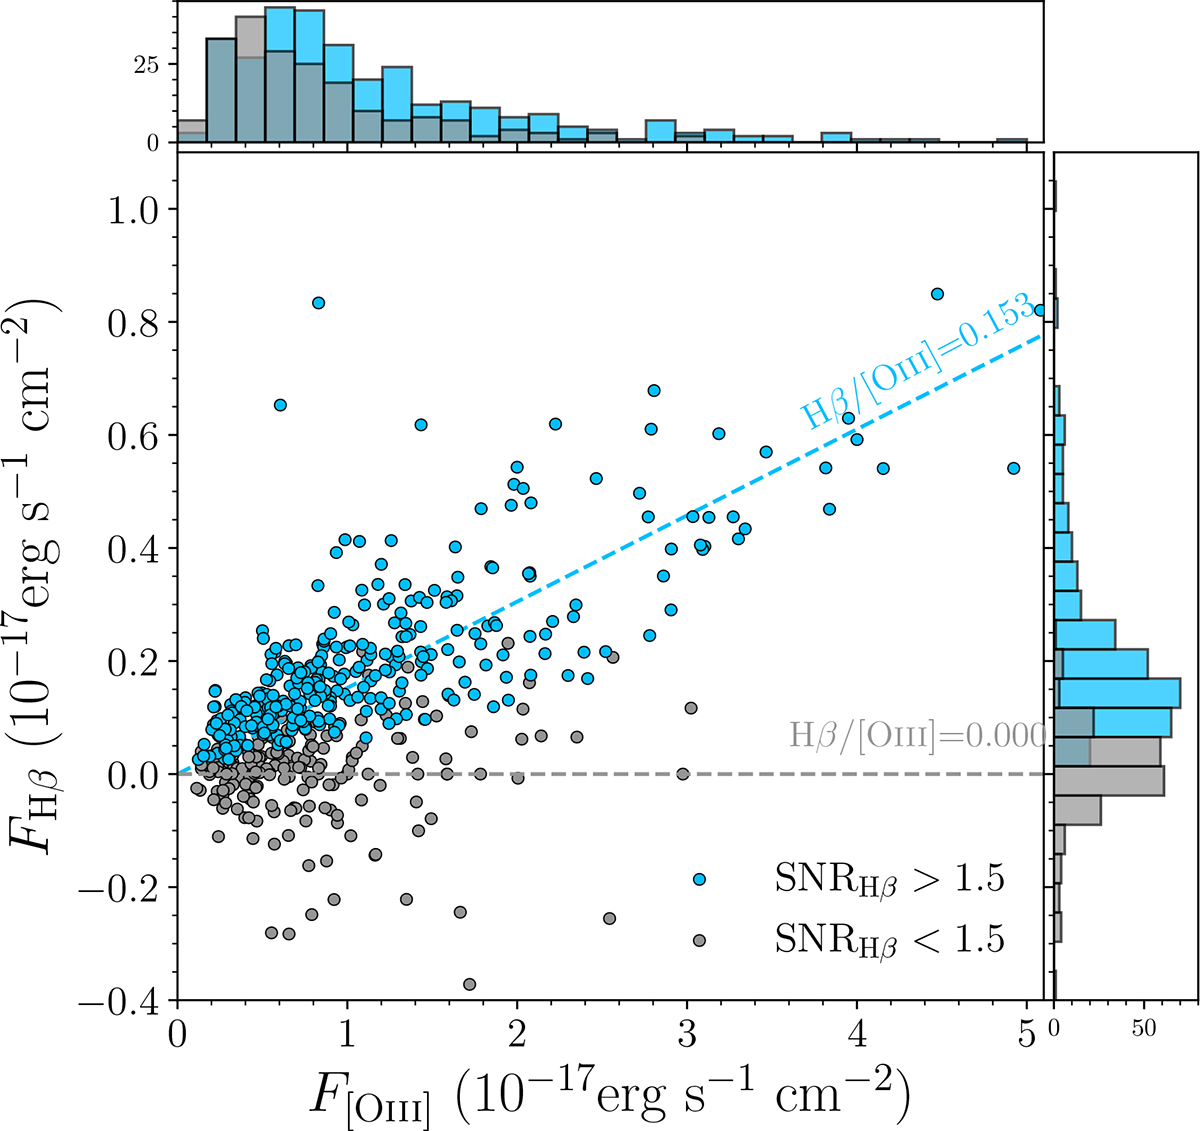
Fig. A.1.
Download original image
Flux distribution of [O III] and Hβ in our sample. The blue circles represent measurements with S/NHβ > 1.5, while the gray circles represent low-quality measurements with S/NHβ < 1.5. The blue dashed line marks the linear regression with the [O III]−Hβ relation, with the slope indicating the inverse of the median R3 ratio. Similar regression is applied to S/NHβ < 1.5 measurements, shown in the gray dashed line. No meaningful relations on R3 are constrained by those low-quality measurements.
Current usage metrics show cumulative count of Article Views (full-text article views including HTML views, PDF and ePub downloads, according to the available data) and Abstracts Views on Vision4Press platform.
Data correspond to usage on the plateform after 2015. The current usage metrics is available 48-96 hours after online publication and is updated daily on week days.
Initial download of the metrics may take a while.