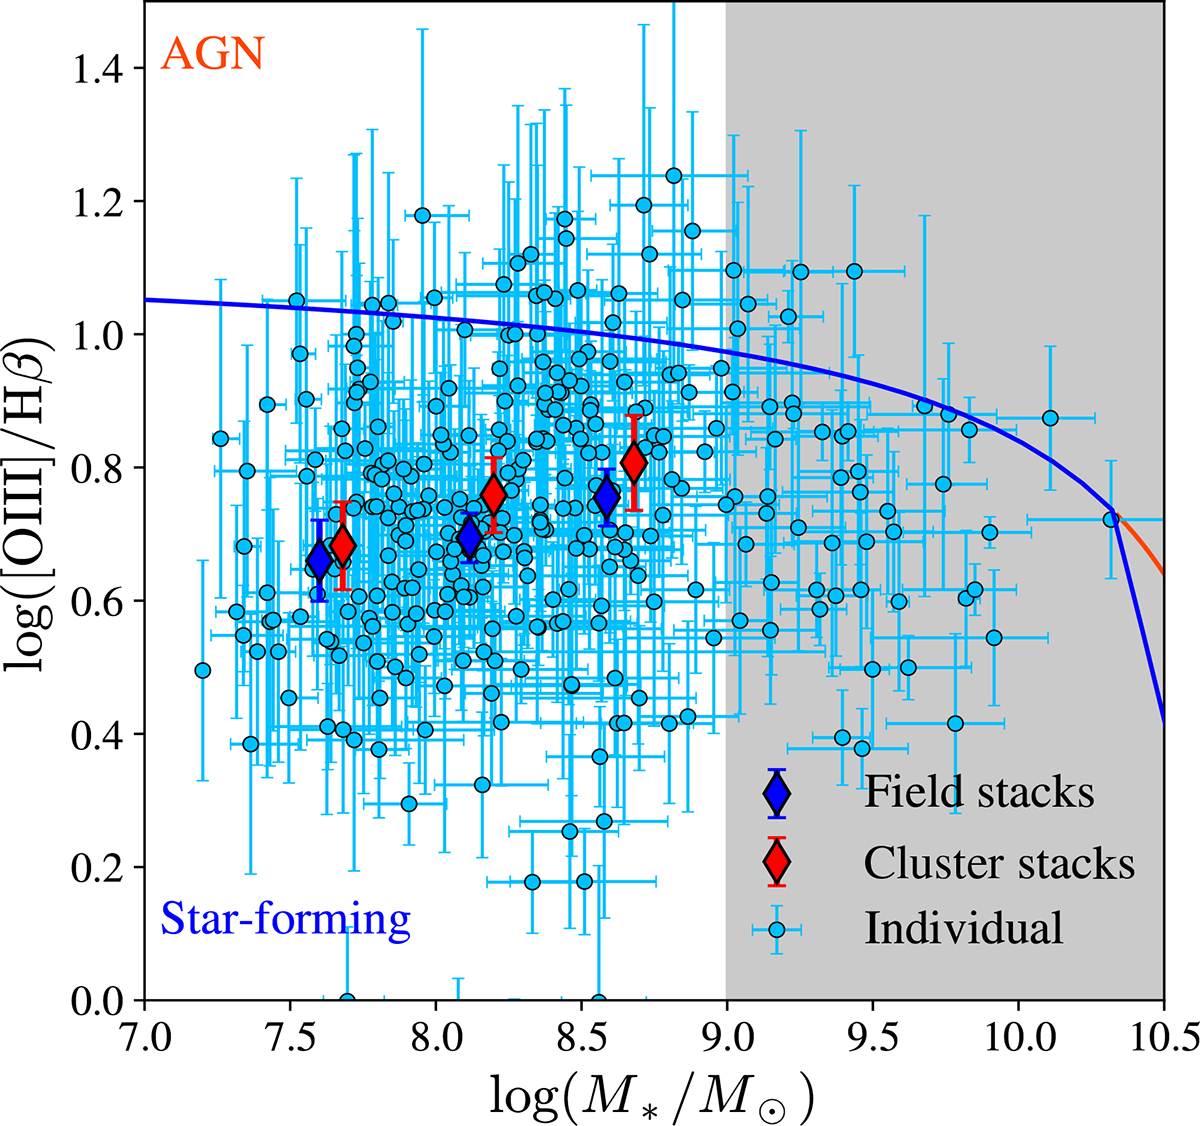
Fig. 3.
Download original image
Mass–excitation diagram for our sample galaxies. The blue circles represent individual measurements. The red and blue diamonds represent stacked measurements in cluster and field galaxies, respectively. The blue and orange curves indicate the lower and upper mass-excitation demarcation by Coil et al. (2015). The AGNs (star-forming galaxies) are above (below) the demarcation. The gray shaded region indicates the high-mass end, which we did not analyze due to uncertainties in the metallicity calibrations in this regime.
Current usage metrics show cumulative count of Article Views (full-text article views including HTML views, PDF and ePub downloads, according to the available data) and Abstracts Views on Vision4Press platform.
Data correspond to usage on the plateform after 2015. The current usage metrics is available 48-96 hours after online publication and is updated daily on week days.
Initial download of the metrics may take a while.