Fig. 12
Download original image
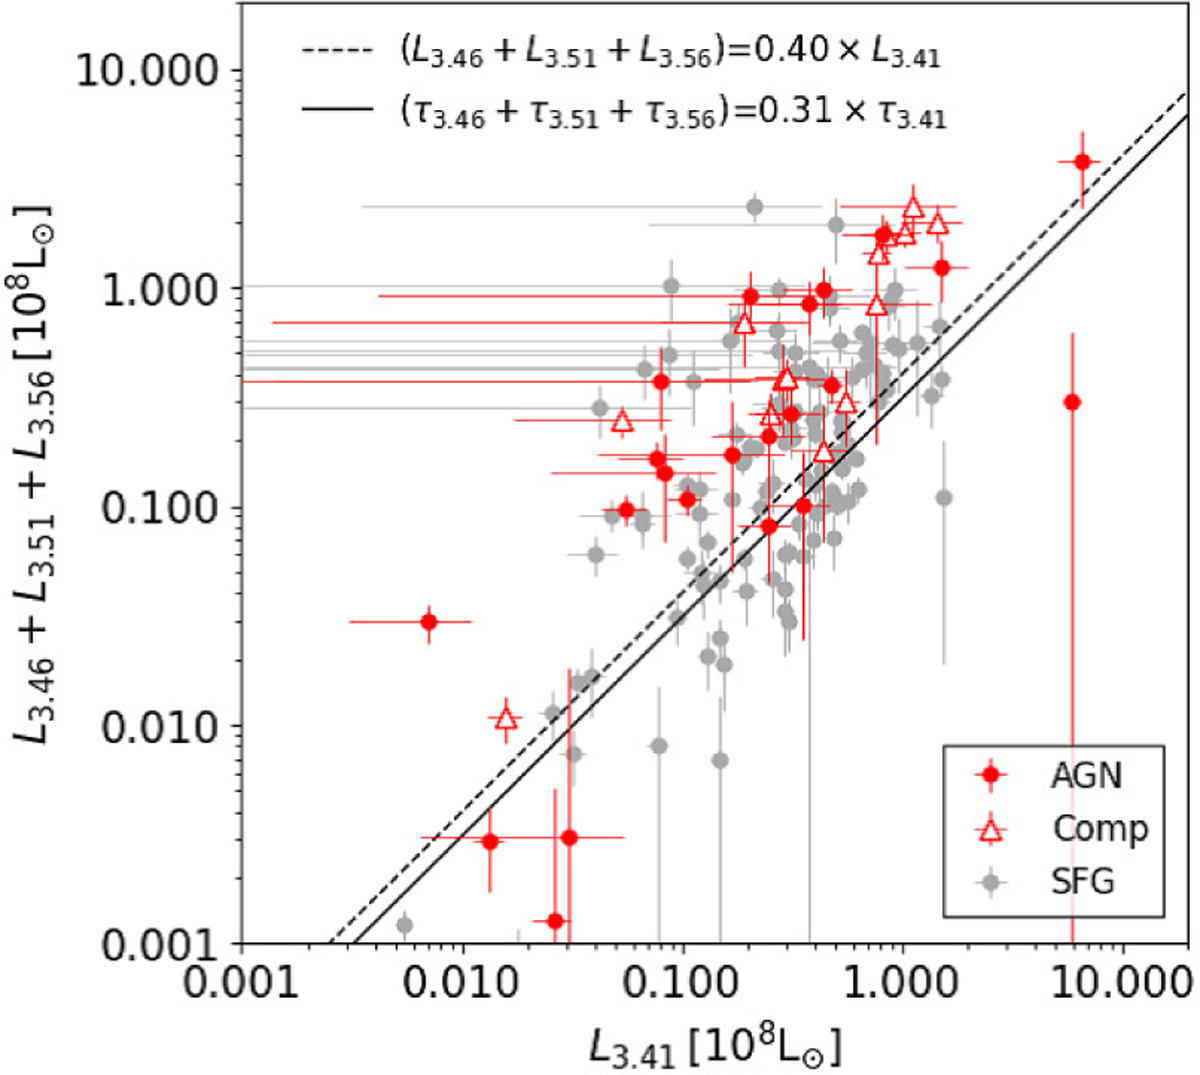
Relationship between the sum of the luminosities of the three aliphatic sub-components (L3.46 + L3.51 + L3.56) and the luminosity of the aliphatic 3.41 μm sub-component (L3.41) for the AGN-dominated (red circles) and AGN-SF-composite galaxies (red triangles). The gray circles show the relationship for the SFG sample, where the dashed line is the best fit to the data points. The solid line is the relationship between τ3.46 + τ3.51 + τ3.56 and τ3.41 obtained for the stacked spectrum of the a-C:H absorption AGN sample shown in Fig. 13b.
Current usage metrics show cumulative count of Article Views (full-text article views including HTML views, PDF and ePub downloads, according to the available data) and Abstracts Views on Vision4Press platform.
Data correspond to usage on the plateform after 2015. The current usage metrics is available 48-96 hours after online publication and is updated daily on week days.
Initial download of the metrics may take a while.