| Issue |
A&A
Volume 703, November 2025
|
|
|---|---|---|
| Article Number | A179 | |
| Number of page(s) | 12 | |
| Section | Interstellar and circumstellar matter | |
| DOI | https://doi.org/10.1051/0004-6361/202555388 | |
| Published online | 13 November 2025 | |
A systematic study on the properties of aromatic and aliphatic hydrocarbon dust in active galactic nuclei with AKARI near-infrared spectroscopy
1
Graduate School of Science, Nagoya University,
Furo-cho, Chikusa-ku, Nagoya,
Aichi
464-8602,
Japan
2
Institute of Liberal Arts and Sciences, Tokushima University,
1-1 Minami-Jyosanjima,
Tokushima-shi,
Tokushima
770-8502,
Japan
3
Institute of Space and Astronomical Science, Japan Aerospace Exploration Agency,
3-1-1 Yoshinodai,
Chuo-ku, Sagamihara
Kanagawa
252-5210,
Japan
★ Corresponding author: This email address is being protected from spambots. You need JavaScript enabled to view it.
Received:
5
May
2025
Accepted:
11
September
2025
Abstract
Recent near- and mid-infrared (IR) observations have revealed the existence of appreciable amounts of aromatic and aliphatic hydrocarbon dust in the harsh environments of active galactic nuclei (AGNs), the origins of which are still under discussion. In this paper, we analyze the near-IR spectra of AGNs obtained with AKARI in order to systematically study the properties of the aromatic and aliphatic hydrocarbon dust affected by AGN activity. We performed spectral fitting and spectral energy distribution fitting for our sample of 102 AGNs to obtain the fluxes of the aromatic and aliphatic spectral features, the total IR luminosity (LIR), and the fractional luminosity of AGN components (LAGN/LIR). As a result, we find that Laromatic/LIR is systematically lower for the AGN sample and especially lower for AGNs with the aliphatic feature seen in the absorption than for star-forming galaxies (SFGs), while Laliphatic/Laromatic is systematically higher for the AGN sample than for the SFG sample, increasing with AGN activity indicated by LAGN/LIR. In addition, the profiles of the aliphatic emission features of the AGN sample are significantly different from those of the SFG sample in that the AGNs have systematically stronger feature intensities at longer wavelengths. We conclude that both aromatic and aliphatic hydrocarbon dust are likely of circumnuclear origin, suggesting that a significant amount of the aliphatic hydrocarbon dust may come from a new population created through processes such as the shattering of large carbonaceous grains by AGN outflows.
Key words: dust, extinction / galaxies: active / galaxies: ISM / galaxies: nuclei / infrared: galaxies
© The Authors 2025
 Open Access article, published by EDP Sciences, under the terms of the Creative Commons Attribution License (https://creativecommons.org/licenses/by/4.0), which permits unrestricted use, distribution, and reproduction in any medium, provided the original work is properly cited.
This article is published in open access under the Subscribe to Open model. This email address is being protected from spambots. You need JavaScript enabled to view it. to support open access publication.
1 Introduction
There are various types of dust in the interstellar medium (ISM), some of which are observed in the infrared (IR) spectral region with characteristic emission and/or absorption features. As typical examples, aromatic and aliphatic hydrocarbon dust can be probed by several spectral features in the near- and mid-IR ranges. Regarding the aromatic hydrocarbon dust, so-called polycyclic aromatic hydrocarbons (PAHs), which are known to exist almost ubiquitously in the ISM, possess planar structures composed of hexagonal rings with 50-1000 carbon atoms (e.g., Allamandola et al. 1985; Tielens 2008). The conspicuous emission features of the aromatic hydrocarbons are observed at 3.3, 6.2, 7.7, 8.6, 11.3, 12.7, and 17 μm, which are produced by stretch, vibrational, or bending modes of C-C or C-H bonds (e.g., Draine & Li 2007). Since these features originate from the excitation of PAHs by absorbing photons from young stars in many cases (e.g., Tielens 2005), the PAH emission has often been used as an indicator of recent star formation (SF) activity. On the other hand, aliphatic hydrocarbon features are observed at 3.4, 6.9, and 7.3 μm (e.g., Dartois et al. 2007), which have multiple spectral substructures produced by the C-H stretching and bending modes of methyl (-CH3), methylene (-CH2), or C-H groups (e.g., Duley & Williams 1983; Kwok 2007; Dartois et al. 2007). For the aliphatic hydrocarbons, their spectral features are found not only in the emission (e.g., Yamagishi et al. 2012) but also in the absorption (e.g., Imanishi et al. 2010); historically, the latter form has been detected more often from Galactic targets (e.g., Sandford et al. 1995). Since the aliphatic absorption feature is likely to be attributed to hydrogenated amorphous carbon grains (a-C:H; e.g., Dartois et al. 2007), which are different from the likely carrier of the aliphatic emission feature, we denote the aliphatic absorption feature as a-C:H to distinguish between the aliphatic emission and absorption throughout the paper.
Active galactic nuclei (AGNs) are known to have a significant impact on the properties of the circumnuclear medium in a host galaxy. In general, the PAH emission is suppressed or absent in a galaxy hosting a powerful AGN (e.g., Smith et al. 2007; LaMassa et al. 2012; Esparza-Arredondo et al. 2018; Sajina et al. 2022), although it is unclear whether it is because the PAH emission is diluted by strong IR continuum emission (e.g., Alonso-Herrero et al. 2014) or because PAHs are destroyed in the severe environment of the circumnuclear region (e.g., Roche et al. 1991; Voit 1992). Nevertheless, several observations have significantly detected the PAH emission features even in powerful AGNs. Alonso-Herrero et al. (2014) suggested that PAHs may survive in the circumnuclear region because the dense cold gas plays a role in shielding PAHs from the hard radiation field of the AGN. Jensen et al. (2017) found that the 11.3 μm PAH emission intensity increases toward the nuclei, suggesting the possibility that photons from the AGNs can directly excite PAHs within a kiloparsec from the nuclei.
Since the hydrocarbon features are expected to be affected by the surrounding interstellar conditions, several studies have discussed the relationship between the fraction of the aliphatic to the aromatic feature intensities and the galactic environment. In the nearby starburst galaxy M82, Yamagishi et al. (2012) found that the aliphatic to aromatic flux ratio in the halo region increases with the distance from the galactic center, suggesting the production of small carbonaceous dust, which carries the 3.4 μm aliphatic emission feature through the shattering of larger carbonaceous grains with the galactic superwinds of M82. A systematic study of star forming galaxies (SFGs) in Kondo et al. (2024) has shown that the aliphatic to aromatic ratios anticorrelate with the interstellar radiation field strength and that galaxies with extremely low aliphatic-to-aromatic ratios are dominated by merger galaxies. The authors concluded that the strong radiation field due to intense star formation and/or mechanical shocks by the galactic merger destroyed the hydrocarbon dust, preferentially for the aliphatic hydrocarbons whose bonds are chemically weaker than the aromatic bonds.
Recently, the James Webb Space Telescope (JWST; Gardner et al. 2023) has revealed detailed properties of PAHs in the multiphase ISM of nearby galaxies at unprecedented spatial resolution and sensitivity in spectroscopy (e.g., Rigopoulou et al. 2024) and PAH-band imaging (e.g., Sandstrom et al. 2023). As for studies on PAHs in nearby AGNs, for example, Lai et al. (2023) found that the aliphatic to aromatic ratios in the galactic nuclear region of the nearby Seyfert galaxy NGC 7469 are significantly lower than those in other regions far from the nucleus, suggesting the photodestruction of PAHs in the nuclear regions. García-Bernete et al. (2022b) investigated the PAH properties of three Seyfert galaxies. The authors indicatated that most of the emission originates from neutral PAHs, possibly due to the effective shielding of the PAHs by high hydrogen column densities, and thus insufficient contribution of the AGN activity to PAH destruction, or the selective destruction of ionized PAHs in AGN-dominated environments. Through a systematic study of JWST/MIRI spectra of local luminous infrared galaxies, Rigopoulou et al. (2024) found that the fractions of the ionized PAHs in SFGs are larger than those in AGNs, while the neutral PAHs are dominant in conditions under hard radiation fields such as those in the nuclear regions of AGNs and their outflows. Furthermore, García-Bernete et al. (2024) compared the properties of PAHs in the AGN-dominated regions along the outflow direction with those in the SF regions and the nuclear regions in local AGNs. They reported that the AGN activity might affect the PAH population on a kiloparsec scale; the fact that the fraction of the ionized PAHs in the outflow regions are lower than that in the SF regions suggests that the ionized PAHs are preferentially destroyed in the harsh environments of AGNs. From the observations of type-2 quasars in the central kiloparsec, Ramos Almeida et al. (2025) report that the PAH-derived SF rates are significantly lower than those derived from optical spectra due to the combination of destruction by the strong radiation of the central AGNs and relatively low gas column densities.
In this paper, we analyze the near-IR spectra of galaxies harboring AGNs obtained with the Infrared Camera (IRC; Onaka et al. 2007) on board AKARI (Murakami et al. 2007) in order to systematically study the properties of the aliphatic and aromatic hydrocarbon features affected by AGN activity.
2 Observation and data analysis
2.1 Sample selection
For the present study, we selected the same samples as used in Kondo et al. (2024), which consist of the galaxies based on the two AKARI mission programs, Mid-infrared Search for Active Galactic Nuclei (MSAGN; Oyabu et al. 2011) and Evolution of ULIRGs (ultra-luminous infrared galaxies, LIR > 1012L⊙) and AGNs (AGNUL; Imanishi et al. 2008, 2010). To exclude the normal stars and quiescent galaxies from the original samples of the above two programs, Kondo et al. (2024) set the sample selection criterion as F(9 or 18 μm)/F(Ks) > 2, where F(9 or 18 μm) and F(Ks) are the flux densities at the 9 or 18 μm band and the Ks band derived from the photometry of the AKARI and 2MASS data, respectively. Based on the criterion, they selected 230 mid-IR excess galaxies, which were regarded as IR galaxies owing to AGNs and/or active SF. Each sample galaxy was classified as AGN-dominated, AGN-SF-composite, or pure-SF galaxies, the numbers of which were 68, 24, and 138, respectively, based on the criteria using the equivalent width of the 3.3 μm PAH emission (EWPAH3.3 μm) and the near-IR continuum slope as described in Kondo et al. (2024). However, these criteria do not account for obscured AGNs such as those hosting compact obscured nuclei (CONs), which can display an EWPAH3.3 μm that is as large as the pure-SF galaxies (e.g., García-Bernete et al. 2025). On the other hand, the criterion using the equivalent width of the PAH emission at 6.2 μm (EWPAH6.2 μm) enables more robust diagnosis. Therefore, we adopted the additional criterion of EWPAH6.2 μm < 270 nm (Stierwalt et al. 2013) and reclassified the pure-SF galaxy sample using the Spitzer/IRS archival spectra. As a result, 17 galaxies were found to be candidates for CONs. Notably, of the 17 galaxies, four were identified as CONs in previous studies (Falstad et al. 2021; García-Bernete et al. 2022a; Donnan et al. 2023), and therefore we added them to the sample as AGN-SF-composite galaxies. Furthermore, six sub-IRG AGNs (e.g., Seyfert galaxies) taken from the AKARI archives were added to the sample to improve the statistics at lower luminosities. In this paper, we focus on 74 AGN-dominated and 28 AGN-SF-composite galaxies (i.e., the total 102 AGNs).
2.2 Near-infrared spectral fitting
In order to investigate the properties of aromatic and aliphatic hydrocarbons in AGNs, we performed model fitting to the AKARI/IRC 2.5-5.0 μm spectra, assuming the full-screen geometry of obscuration by dust. In this study, depending on the situation, we used one of the following fitting functions, Fν,:
 (1)
(1)
in the case that the aliphatic features are detected in the emission, or
 (2)
(2)
in the case that the a-C:H absorption features are detected. In the fitting functions, τH2O ice, τCO2 ice, and τCO gas are the optical depths for H2O ice, CO2 ice, and CO gas. When it was not clear whether the aliphatic features are seen in the emission or absorption by visual inspection, we attempted to fit the spectra with each function and chose the one with the better fit. The function Fcont is the flux density representing the stellar and thermal dust continua. The functions Faromatic, Faliphatic, and Frecomb are the flux densities of the aromatic and aliphatic hydrocarbon emission features and the hydrogen recombination lines, respectively, while τaliphatic is the optical depth of the a-C:H absorption features.
For the AGN-SF-composite and AGN-dominated galaxies, the global shape of the near-IR continuum varies, depending on the fractional contribution of the star formation activity in a host galaxy. In order to fit the continuum, we adopted the following function:
 (3)
(3)
where A and C are the amplitudes of the power-law and the modified blackbody component, respectively, and Γ is the powerlaw index. We added the modified blackbody component to reproduce the emission of the hot dust heated by AGN activity, whereas Kondo et al. (2024) used a power-law function alone for the continuum to fit the near-IR spectra of SFGs. In the case that the fitting result is rejected by the chi-square test, we instead adopted a cubic function to fit the continuum. In fitting the 3.3 μm aromatic hydrocarbon feature and the 3.4-3.6 μm aliphatic hydrocarbon features, we used the same method as described in Kondo et al. (2024). For the aromatic hydrocarbon feature, a Drude profile (Li & Draine 2001) was adopted:
 (4)
(4)
where λr is the central wavelength fixed at λr = 3.3 μm in the rest frame, while a and b are the peak flux density at λr and the full width at half maximum divided by λr, respectively. Kondo et al. (2024) characterized the 3.4-3.6 μm aliphatic hydrocarbon features by four representative discrete sub-components at the central wavelengths of 3.41, 3.46, 3.51, and 3.56 μm, referring to previous studies (Sloan et al. 1997; Li & Draine 2012), where a Lorentzian profile is used for the first sub-component that is broad enough to be resolved with the AKARI/IRC spectral resolution, while Gaussian profiles are used for the other three narrow sub-components. In order to estimate the flux error of the aliphatic emission feature, we fixed the relative strengths of the four sub-components at the best-fit values and refit the spectra. We assumed the same four sub-components to characterize the a-C:H absorption features, which facilitated the comparison between the profiles of the emission and absorption features we present in the discussion. We confirm that the model of Dartois et al. (2007) for the a-C:H absorption features does not improve the spectral fitting significantly. We used a Lorentzian profile for the absorption features of H2O ice, CO2 ice, and CO gas, where the central wavelengths are fixed at 3.05, 4.27, and 4.60 μm, respectively. Within the wavelength range of 2.5-5.0 μm, we considered four relatively strong hydrogen recombination lines, Brγ, Pfγ, Brα, and Pfβ, at the central wavelengths of 2.62, 3.74, 4.05, and 4.63 μm, respectively, where Gaussian profiles were adopted for all four components. Examples of the near-IR spectral fitting results for the AGN sample are shown in Fig. 1.
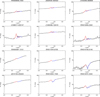 |
Fig. 1 Examples of the spectral fitting results for the AKARI/IRC rest frame 2.5-4.2 μm spectra of AGN-dominated and AGN-SF-composite galaxies. The top two rows show examples of the cases where the aliphatic hydrocarbon features are detected in the emission, while the bottom two rows show those detected in the absorption. A black line shows the total model spectrum, while red and blue lines correspond to the aromatic and aliphatic hydrocarbon features, respectively. |
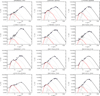 |
Fig. 2 Examples of the SED fitting results for the same galaxies as in Fig. 1. A black line shows the total model spectrum, while a red line corresponds to the continuum emitted by hot dust. Grey lines show the stellar continuum, neutral and ionized PAHs, the continua emitted by warm dust components, and the continua emitted by SamC, LamC, and aSil, respectively, from short to long wavelengths. Black circles and blue squares represent the fluxes observed in the respective bands and predicted by the model SED, respectively. |
2.3 Infrared spectral energy distribution fitting
We conducted IR spectral energy distribution (SED) fitting using the dust model based on DustEM (v1.2; Compiègne et al. 2011). For the fitting, we used near- to far-IR photometric data obtained with AKARI, the Wide-field Infrared Survey Explorer (WISE; Wright et al. 2010), and the Infrared Astronomical Satellite (IRAS; Neugebauer et al. 1984), which comprise the dataset also used in Kondo et al. (2024). In addition, in order to better trace the PAH emission and the hot dust component in the near-IR wavelength, we binned the AKARI/IRC spectra to three data points and used them as additional photometric values. The wavelength, the flux density, and the flux density error of each of the photometric values derived by the spectral binning are defined as follows:
 (5)
(5)
where λi, Fi, and σi are the wavelength, the flux density, and the flux density error, respectively. The subscript i denotes the order of the photometric value after the spectral binning (i = 1, 2, 3), while N is the total number of the data points included in the AKARI/IRC spectrum.
The DustEM model contains the following five dust components: neutral and ionized PAHs (nPAH and iPAH), small (sub-nanometer) and large (sub-hundred nanometer) amorphous carbon (SamC and LamC), and amorphous silicate (aSil). In this paper, for the purpose of better reproducing the continua of stars and the dust components heated by AGNs, we added a blackbody and two modified blackbody functions to the original DustEM model, where the temperatures were fixed at 3000 K for the stellar continuum and 350-550 K and 60-200 K for the hot and warm dust components, respectively, while the amplitudes were allowed to vary. The fitting parameters of our model are the mass abundance per hydrogen for each dust component assuming the gas column density of NH = 1 × 1020cm−2 (YnPAH, YiPAH, YSamC, YLamC, and YaSil), the amplitudes of the blackbody function and the two modified blackbody functions, and the interstellar radiation field parameter G0, which is a scaling factor of the radiation field intensity integrated between 6-13 eV relative to the solar neighborhood interstellar radiation field. As a result of the SED fitting, we derived the total IR luminosity (LIR), where LIR is the sum of the luminosities of all the dust components except the stellar continuum. Examples of the IR SED fitting result for the AGNs and composite galaxies are shown in Fig. 2.
Furthermore, in order to estimate the AGN activity, we conducted the SED fitting using another model consisting of the emission components from AGN, PAHs, warm dust, and cold dust. For the AGN component, we used the template spectra of type-1 and type-2 AGNs from the SWIRE template library (Polletta et al. 2007), where the contribution fraction of type-1 and type-2 AGNs and the amplitude are allowed to vary. We adopted the Draine & Li (2007) model for the PAH emission and allowed only the amplitude of the PAH emission to vary. For the warm and cold dust components, we adopted modified blackbody models with the emissivity power-law index β = 2, where the amplitudes and temperatures are allowed to vary. As a result of the fitting, we derived the luminosity of the AGN component (LAGN). Examples of the IR SED fitting result using the above model for the AGNs and composite galaxies are shown in Fig. 3.
Finally, out of the 102 AGNs in our original sample, 96 and 90 AGNs were accepted for the spectral fitting and the SED fitting, respectively, while 90 AGNs were accepted for both fittings, the breakdown of which is 62 AGN-dominated and 28 AGN-SF-composite galaxies, as summarized in Table 1. For the remaining 12 AGNs, the results of the spectral fitting or the SED fitting were rejected through a chi-square test with a confidence level of 90%. Most of these AGNs show strong absorption features, and their SEDs are difficult to fit successfully with the above SED model. In order to make a fair comparison between the AGN and SFG samples, we also analyzed the data of the SFG sample presented in Kondo et al. (2024) using our spectral and SED fitting models, which are optimized for analyzing the AGN spectra. As for the SED fitting, we used the above-mentioned first model to estimate LIR for the AGN and SFG samples, while we used the second model to estimate LAGN for the AGN sample.
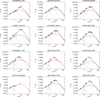 |
Fig. 3 Same as Fig. 2 but the SEDs were fit with a model containing AGN template spectra (see text for details). |
Luminosity class and type of our sample galaxies.
3 Results
3.1 Aromatic hydrocarbon emission feature in AGNs
Among the 96 AGNs accepted for the spectral fitting, we detected the aromatic feature at 3.3 μm with a significance of above 3σ for 78 AGNs and above 5σ for 65 AGNs. Figure 4 shows Laromatic/LIR as a function of LIR for all of our sample, which consists of 68 AGN-dominated, 28 AGN-SF-composite, and 122 SFGs. In comparison with the SFG sample, most of the AGN sample shows a considerably low Laromatic/LIR (10−7 < Laromatic/LIR < 10−3); specifically, it is one to four orders of magnitude lower than Laromatic/LIR for the SFG sample. Regarding the SFG sample, our result shows that the Laromatic/LIR significantly decreases with LIR for LIRGs and ULIRGs (LIR > 1011L⊙), which confirms the results in Yamada et al. (2013) and Kondo et al. (2024), although our models for the spectral and the SED fitting include the hot dust components representative of the AGN contribution which their models did not. The AGN sample also shows a globally decreasing trend with LIR, similar to the SFG sample.
In Fig. 5a, we plot Laromatic/LIR and color code it separately for the samples with the aliphatic features detected in the emission (red) and the a-C:H features detected in the absorption (blue). From the figure, we observed that the Laromatic/LIR distributions of the aliphatic emission and the a-C:H absorption AGN samples are clearly separated from each other. The aliphatic emission AGN sample (red) shows a relatively high Laromatic/LIR, but it is still systematically lower than that for the SFG sample (gray) in the IRG and LIRG luminosity classes. The Laromatic/LIR values of the aliphatic emission AGN sample have no significant dependence on LIR, the trend of which is different from that of the SFG sample where Laromatic/LIR decreases with LIR. To evaluate the statistical significance, we applied a Kolmogorov-Smirnov test (KS test) to confirm that their distributions are different with a significance level of 5%.
On the other hand, most of the a-C:H absorption AGN sample (blue) in Fig. 5a show a considerably low Laromatic/LIR. Among the a-C:H absorption AGN sample, six galaxies show a Laromatic/LIR as high as the SFG sample at around LIR = 1012L⊙, and all of these galaxies belong to the composite galaxy population. Except for those galaxies, Laromatic/LIR significantly decreases with LIR. Figure 5b shows τ3.41 plotted as a function of LIR for the a-C:H absorption AGN sample, from which we find that τ3.41 significantly increases with LIR. The comparison of Figs. 5a and 5b suggests that the decrease in Laromatic/LIR for the a-C:H absorption AGN sample in Fig. 5a may be attributed to the interstellar dust extinction represented by τ3.41. As seen in Fig. 5b, τ3.41 is large for ULIRGs (LIR > 1012L⊙), which are basically dust-rich galaxies, supporting that the absorbing aliphatic hydrocarbons are likely of interstellar dust origins rather than of circumnuclear ones.
In Fig. 6a, we plot Laromatic/LIR as a function of LAGN/LIR. For a galaxy hosting an AGN, LAGN/LIR corresponds to the fractional luminosity of the dust heated by the AGN, and thus it is considered a likely indicator of AGN activity. As shown in the figure, Laromatic/LIR is not clearly correlated with LAGN/LIR for either aliphatic emission or a-C:H absorption samples. For AGNs with relatively low AGN activity (LAGN/LIR ≲ 0.1), the Laromatic/LIR ratios are bifurcated into low and high levels, the latter of which mostly belong to the composite galaxy population. In Fig. 6b, considering a possibility that the decrease in Laromatic/LIR for the absorption AGN sample in Fig. 5a could be explained by a larger contribution of LAGN to LIR, we also plot Laromatic/(LIR - LAGN) as a function of LIR, from which we confirm that the decreasing trend still holds.
Hence, most of the AGN-dominated galaxies with the a-C:H features detected in the absorption, especially those in the ULIRG class (LIR > 1012L⊙), have very low Laromatic/LIR values (<10−5), suggesting that aromatic hydrocarbons exist mainly in the circumnuclear region and that their emission is strongly suppressed due to the interstellar dust extinction in the outer regions of the host galaxy. This is likely to also be the case for the AGN-dominated galaxies with the aliphatic feature detected in the emission. As seen in Fig. 6a, for AGNs with relatively high activity (LAGN/LIR ≳ 0.2), the Laromatic/LIR values are instead continuously distributed within the range of 10−7 to 10−3, which may be explained by the difference in the inclination angle of the galactic disk with respect to the line of sight (i.e., near edge-on or face-on configuration). On the other hand, some of the AGN-SF-composite galaxies show a relatively high Laromatic/LIR whether the aliphatic feature is detected in the emission or the a-C:H feature is detected in the absorption, and therefore those galaxies are considered to have aromatic hydrocarbons distributed more widely in the outer interstellar regions of a host galaxy.
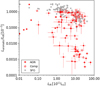 |
Fig. 4 Scatter plot of Laromatic/LIR as a function of LIR for the AGN-dominated (red circles) and AGN-SF-composite galaxies (red triangles). The gray circles show the relationship for the SFG sample. |
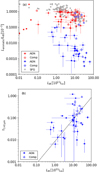 |
Fig. 5 (a) Same as Fig. 4 but color coded separately for the aliphatic feature detected in the emission (red) and in the absorption (blue). (b) Scatter plot of τ3.41 as a function of LIR for the AGN sample. |
3.2 Aliphatic hydrocarbon emission features in AGNs
We show the result of the spectral fitting on the aliphatic emission features in Fig. 7, where Laliphatic/LIR is plotted as functions of LIR and LAGN/LIR in panels (a) and (b), respectively. For the SFG sample, we also plot the result of our re-analysis in panel (a), which exhibits that Laliphatic/LIR decreases with LIR, which is consistent with the result in Kondo et al. (2024). As a whole, Laliphatic/LIR shows similar values between the AGN and SFG samples. The KS test shows that the distributions of the AGN and SFG samples are not different from each other, with a significance level of 5%. Unlike the SFG sample, Laliphatic/LIR of the AGN sample shows no apparent dependence on LIR (Fig. 7a) but an increasing trend with LAGN/LIR (Fig. 7b). The latter result suggests that the emitting aliphatic hydrocarbons may be of cir-cumnuclear origin and significantly affected by AGN activity, while the absorbing aliphatic hydrocarbons are likely of interstellar origin, as mentioned in Section 3.1. It is notable that the former hydrocarbons are more likely to be produced rather than destroyed by the AGN activity.
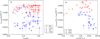 |
Fig. 6 (a) Same as Fig. 5a but plotted as a function of LAGN/LIR for the AGN sample. (b) Same as Fig. 5a, but Laromatic/LIR is replaced with Laromatic/(LIR - LAGN) and plotted for the AGN-dominated galaxies. |
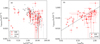 |
Fig. 7 Scatter plots of Laliphatic/LIR as functions of (a) LIR and (b) LAGN/LIR for the AGN-dominated (red circles) and AGN-SF-composite galaxies (red triangles). The gray circles in panel a show the relationship for the SFG sample. |
3.3 Relationships between the aliphatic-to-aromatic ratios and the AGN activity
We show the results related to the aliphatic-to-aromatic ratios for the aliphatic emission AGN sample. Figure 8 displays Laliphatic/Laromatic plotted as a function of LIR. As can be seen in the figure, the SFG sample shows that Laliphatic/Laromatic decreases with LIR toward the LIRG and ULIRG classes, as already pointed out by Kondo et al. (2024). On the other hand, for the AGN sample, Laliphatic/Laromatic shows no apparent dependence on LIR. As a whole, we find the Laliphatic/Laromatic values of the AGN sample to be systematically higher than those of the SFG sample. The KS test indeed shows that their distributions are significantly different, with a significance level of 5%.
Since the aliphatic feature is detected in both emission and absorption, as mentioned above, Laliphatic/Laromatic in Fig. 8 might be potentially affected by the a-C:H absorption. Since our fitting model for the aliphatic emission sample does not consider any a-C:H absorption, we evaluated such an effect based on τ3.1 (H2O ice), as performed in Kondo et al. (2024). In Fig. 9a, we plot the relationship between τ3.41 and τ3.1, which shows a clear correlation between them. We corrected the Laliphatic value using τ3.41, which is estimated from its correlation with τ3.1 in Fig. 9a, where we derived the relation of τ3.41/τ3.1 = 1.25 for the a-C:H absorption AGN sample. Figure 9b shows Laliphatic/Laromatic thus corrected for the a-C:H absorption plotted as a function of LIR, where the systematic errors associated with galaxy-to-galaxy variations of the relative abundance of H2O ice are considered by assuming that the absorption correction factor can vary by a factor of two. We confirm that the absorption effect, if any, is negligibly small. Thus we use the uncorrected Laliphatic value in the subsequent result and discussion.
We investigated the relationship between Laliphatic/Laromatic and indicators of the AGN activity. In Fig. 10a, we plot Laliphatic/Laromatic as a function of LAGN/LIR, from which we found that Laliphatic/Laromatic significantly increases with Lhot/LIR. In Fig. 10b, we plot Laliphatic/Laromatic as a function of the equivalent width of the aromatic emission feature, EWPAH, where EWPAH generally takes a smaller value when the AGN activity is stronger relative to the SF activity (e.g., Imanishi & Dudley 2000). As seen in Fig. 10b, Laliphatic/Laromatic decreases with EWPAH, which is consistent with the increase in Laliphatic/Laromatic and thus with the AGN activity (Fig. 10a). To further visualize those results, we stacked the 3.15-3.65 μm spectra for the aliphatic emission AGN samples with LAGN/LIR > 0.4 (red) and LAGN /LIR < 0.4 (blue) separately, as shown in Fig. 11. Hence the relative abundance of the aliphatic to aromatic hydrocarbons tends to increase with the AGN activity, which is likely to be caused by the production of aliphatic hydrocarbons through some processes related to the AGN activity, as suggested in Section 3.2.
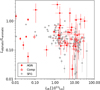 |
Fig. 8 Scatter plot of Laliphatic/Laromatic as a function of LIR for the AGN-dominated (red circles) and AGN-SF-composite galaxies (red triangles). The gray circles show the relationship for the SFG sample. |
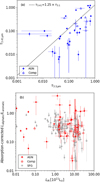 |
Fig. 9 (a) Relationship between τ3.41 and τ3.1 (H2O ice) for the AGN-dominated (circles) and the AGN-SF-composite galaxies (triangles), both with the a-C:H absorption features. (b) Same as Fig. 8 but corrected for the a-C:H absorption that is estimated from the τ3.41-τ3.1 relation in panel (a). The thick error bars correspond to the systematic errors (see text for details). |
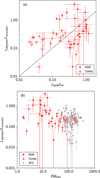 |
Fig. 10 Scatter plots of Laromatic/Laliphatic as functions of (a) LAGN/LIR and (b) EWPAH for the AGN-dominated (red circles) and the AGN-SF-composite galaxies (red triangles). The gray circles in panel (b) show the relationship for the SFG sample. |
4 Discussion
4.1 Properties of aliphatic hydrocarbons in AGNs
To study the properties of the aliphatic hydrocarbons in the AGN sample, we investigated the relationship between the relative strengths of the four spectral sub-components characterizing the aliphatic feature. Considering a balance of the statistical significance, we added the fluxes of the three longer wavelength sub-components (3.46, 3.51, and 3.56 μm) and obtained their relationship with the 3.41 μm sub-component. In Fig. 12, we plot the relationship between the sum of the luminosities of the three aliphatic sub-components (L3.46 + L3.51 + L3.56) and the luminosity of the aliphatic 3.41 μm sub-component (L3.41). To estimate the flux errors of L3.46 + L3.51 + L3.56 and L3.41, we fixed the relative strengths of the three longer wavelength sub-components at the best-fit values and refit the spectra. Figure 12 shows the results of both AGN and SFG samples, where the best-fit relation for the SFG sample is indicated by the dashed line for comparative purposes. The figure suggests that the profiles of the aliphatic emission features of the AGN sample may be different from those of the SFG sample in that the feature intensities of the AGN sample are systematically stronger at longer wavelengths.
To visualize the shape of the aliphatic feature more robustly, we stacked the 3.2-3.65 μm spectra for the aliphatic emission AGN sample and the a-C:H absorption AGN sample separately. For the purpose of comparison, as shown in Fig. 13, the flux density and the optical depth, which are given in arbitrary units, are scaled so that the integral of each of the emission and the absorption feature with respect to the frequency has the same area with each other. In the figure, we recognize a clear difference in the profile of the aliphatic feature between the emission and the absorption: The 3.41 μm sub-component is weaker relative to the longer wavelength sub-components in the emission feature than in the absorption feature. Figure 13c more clearly demonstrates such a significant difference in the properties of the hydrocarbons between the aliphatic emission and the a-C:H absorption feature. We characterized the stacked absorption feature in Fig. 13b with the absorption model described in Section 2.2 to obtain the relation of τ3.46 + τ3.51 + τ3.56 = 0.31 × τ3.41, which is much closer to the relationship between L3.46 + L3.51 + L3.56 and L3.41 for the SFG sample than for the AGN sample, as indicated by the solid line in Fig. 12. Hence, even within the AGN sample, the properties of aliphatic hydrocarbons are different between those emitting and absorbing, the latter of which are thought to exist in the interstellar space of host galaxies (Sections 3.1 and 4.2), and thus it is reasonable that their properties are similar to those of the SFG sample.
The relative strengths of the sub-components characterizing the aliphatic feature are expected to change, depending on differences in the stretching mode and the chemical composition of the hydrocarbons. The aliphatic feature at 3.4-3.6 μm consists of both symmetric and asymmetric stretching modes, where the asymmetric modes exhibit the peak at shorter wavelengths than the symmetric modes (Kwok 2012). Regarding the chemical composition relevant to the C-H vibration, the spectral feature of methyl (-CH3) groups have peaks at shorter wavelengths, while those of methylene (-CH2) groups and C-H groups have peaks at longer wavelengths (Kwok 2012). Therefore, the difference in the profile of the aliphatic emission feature relative to the a-C:H absorption feature favors the conditions that the emitting hydrocarbons are less excited in the asymmetric stretching modes and more C-rich in chemical composition. The former suggests that a typical temperature of the hydrocarbon dust may be lower, and thus its typical size may be larger, while the latter implies that hydrogenated amorphous carbons, for instance, are more likely to be representatives of the emitting aliphatic feature carriers than chain-like hydrocarbons.
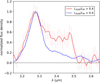 |
Fig. 11 AKARI/IRC 3.15-3.65 μm stacked spectra of the AGN samples with LAGN/LIR > 0.4 (red) and LAGN/LIR < 0.4 (blue). |
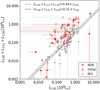 |
Fig. 12 Relationship between the sum of the luminosities of the three aliphatic sub-components (L3.46 + L3.51 + L3.56) and the luminosity of the aliphatic 3.41 μm sub-component (L3.41) for the AGN-dominated (red circles) and AGN-SF-composite galaxies (red triangles). The gray circles show the relationship for the SFG sample, where the dashed line is the best fit to the data points. The solid line is the relationship between τ3.46 + τ3.51 + τ3.56 and τ3.41 obtained for the stacked spectrum of the a-C:H absorption AGN sample shown in Fig. 13b. |
4.2 Possible origins of aromatic and aliphatic hydrocarbons in AGNs
As described in Section 3.1, Laromatic/LIR decreases with τ3.41, indicating that the aromatic emission is affected by the a-C:H absorption and thus the interstellar dust extinction. To confirm the validity of this picture, we corrected Laromatic/LIR using the standard extinction curve. From the near-IR continuum extinction (AL/AV = 0.056; Cardelli et al. 1989) and the 3.4 μm optical depth relative to the visual extinction (AV/τ3.4 ≈ 300 in the local diffuse ISM; Gao et al. 2010), we estimated the optical depth of the near-IR continuum around the aromatic feature, τcont, to be τcont ≈ 20 × τ3.4. Assuming that an optical depth typical of ULIRGs is τ3.41 ≈ 0.2 (Fig. 5b), the extinction-corrected Laromatic/LIR is estimated to be 30 times larger and thus becomes comparable to the Laromatic/LIR of the aliphatic emission AGN sample. Therefore, in line with the results of previous studies (e.g., Alonso-Herrero et al. 2014; Jensen et al. 2017; García-Bernete et al. 2022b), the aromatic hydrocarbons likely exist in the circumnuclear region, which are shielded from the hard radiation field by the dense gas surrounding the AGNs, and their emission is attenuated significantly by the interstellar dust extinction in the host galaxy. Moreover, as seen in Fig. 5b, galaxies classified as AGN-SF-composite have a τ3.41 significantly larger than AGN-dominated galaxies at high luminosities. Given that many ULIRGs are known to host CONs (e.g., Falstad et al. 2021), most of them may belong to AGNs with the CONs and not be significantly affected by the AGN activity. In this context, after revisiting Figs. 5a, 7a, and 8, we find that the AGN-SF-composite ULIRGs show the properties of the aromatic and aliphatic emission features similar to those of the SFG sample, thus making it reasonable to interpret that the PAHs are shielded by dense gas surrounding CONs.
In the following, we discuss the origin of the aliphatic hydrocarbons in AGNs. As described in Section 3.2, the aliphatic emission intensities have an increasing trend with the AGN activity, suggesting that the aliphatic hydrocarbons may exist within the reach of the AGN activity and thus in the cir-cumnuclear region, similar to the aromatic hydrocarbons. If the emission features of the aliphatic and aromatic hydrocarbons were of the same carrier origins, such as mixed aromatic-aliphatic organic nanoparticles (Kwok & Zhang 2011, 2013), the aliphatic hydrocarbons would likely be removed more easily since the aliphatic bonds are chemically weaker than the aromatic ones. Indeed, the JWST observation of the Seyfert galaxy NGC 7469 shows that the aliphatic-to-aromatic ratio becomes lower near the nucleus (Lai et al. 2023), and some of our AGNs also show a relatively low Laliphatic/Laromatic, especially at low luminosities. On the contrary, for a significant fraction of the other AGNs, Laliphatic/Laromatic increases with the AGN activity as shown in Fig. 10, and thus the aliphatic hydrocarbons present in the circumnuclear region are likely to be of different carrier origins from the aromatic hydrocarbons. Those aliphatic hydrocarbons may come from a new population created through processes such as shattering of aliphatic-rich amorphous carbon dust (e.g., Jones et al. 2013) by AGN outflows. For example, Yamagishi et al. (2012) suggested the production of small carbonaceous dust through shattering of larger carbonaceous grains in the harsh galactic halo of M82. Although Jones et al. (2013) suggested rather aromatic-rich carbonaceous dust surfaces processed by the interstellar UV field, the carbonaceous dust may mostly remain aliphatic rich in the present case, since the hard radiation field can be suppressed by the dense gas surrounding the AGNs.
Finally, we discuss how the likely new dust population may be related to the unusual properties of the aliphatic emission feature in the AGN sample as described in Section 4.1. Figure 14 shows the scatter plot of the relative strengths of the aliphatic sub-components (L3.46 + L3.51 + L3.56)/L3.41 as a function of Laliphatic/Laromatic, from which we find that the distribution of the data points of the AGN sample is well separated from that of the SFG sample. Regarding the SFG sample, our new finding, which was not discussed in Kondo et al. (2024), is that the properties of the aliphatic emission features, (L3.46 + L3.51 + L3.56)/L3.41, clearly change with the decreasing Laliphatic/Laromatic from IRG to ULIRGs, as seen in Fig. 14. This may suggest that the small H-rich aliphatic hydrocarbons are more easily photodissociated under the strong radiation fields associated with active SF, resulting in the dominance of relatively large C-rich aliphatic hydrocarbons in such harsh interstellar conditions. On the other hand, for the AGN sample, (L3.46 + L3.51 + L3.56)/L3.41 stays at a level as high as the ULIRGs of the SFG sample, while Laliphatic/Laromatic extends to ratios higher than those of the IRGs, suggesting that the new population of relatively largesized aliphatic hydrocarbon dust created in the circumnuclear region increases Laliphatic/Laromatic, which may possess C-rich chemical compositions intrinsically, as discussed in Section 4.1.
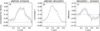 |
Fig. 13 AKARI/IRC 3.2-3.65 μm stacked spectra of the AGN sample. (a) Aliphatic emission and (b) a-C:H absorption features, where the continuum emission, the 3.3 μm aromatic hydrocarbons emission feature, and the H2O ice absorption feature are removed, i.e., Faliphatic and τaliphatic in equations (1) and (2). (c) Difference between their profiles. |
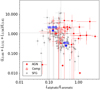 |
Fig. 14 Scatter plot of the relative strength of the aliphatic subcomponents (L3.46 + L3.51 + L3.56)/L3.41 as a function of Laliphatic/Laromatic for the AGN-dominated (red circles) and AGN-SF-composite galaxies (red triangles). The gray circles show the relationship for the SFG sample. The blue star marks show the mean values of the IRGs and the ULIRGs for the SFG sample. |
5 Conclusions
We have conducted spectral fitting and SED fitting for our sample of 102 AGNs in order to estimate the properties of the aromatic and aliphatic hydrocarbon dust under the influence of AGN activity. For the aromatic hydrocarbons, 65 AGNs are detected at above 5σ. The Laromatic/LIR values of the AGN sample are systematically lower than those of the SFG sample and much lower for the a-C:H absorption AGN sample, suggesting that their emission is significantly suppressed due to the interstellar dust extinction in the outer regions of the host galaxy. On the other hand, the Laliphatic/Laromatic values of the AGN sample are systematically higher than those of the SFG sample. Regarding the relationship with the AGN activity, the Laliphatic/Laromatic of the AGN sample shows an increasing trend with the fractional luminosity of the AGN component, LAGN/LIR. The overall results indicate that both aromatic and aliphatic hydrocarbon dust may be of circumnuclear origins; in particular, a significant fraction of the observed aliphatic hydrocarbon dust is likely to be newly produced due to interaction through processes such as the shattering of large carbonaceous grains by AGN outflow, which can explain the high Laliphatic/Laromatic of the AGN sample.
Furthermore, by comparing the profiles of the aliphatic features of the aliphatic emission and the absorption AGN samples, we found a clear difference in the shapes of their profiles. The longer-wavelength sub-components are relatively strong in the emission feature, while the 3.41 μm sub-component is relatively strong in the absorption feature, which is similar to the profile usually seen in SFGs of LIR lower than 1012 L0. The newly produced aliphatic hydrocarbons in AGNs may be attributed to the unusual profiles of the aliphatic emission feature.
Acknowledgements
We thank the referee for giving us useful comments. This research is based on observations with AKARI, a JAXA project with the participation of ESA. This publication makes use of data products from the Wide-field Infrared Survey Explorer, which is a joint project of the University of California, Los Angeles, and the Jet Propulsion Laboratory/California Institute of Technology, funded by the National Aeronautics and Space Administration, and data products from the Infrared Astronomical Satellite (IRAS), which is a joint project of the US, UK and the Netherlands. Spitzer Space Telescope is operated by the California Institute of Technology for NASA under NASA contract 1407. This work was supported by JSPS KAKENHI Grant Number 24K07094.
References
- Allamandola, L. J., Tielens, A. G. G. M., & Barker, J. R. 1985, ApJ, 290, L25 [Google Scholar]
- Alonso-Herrero, A., Ramos Almeida, C., Esquej, P., et al. 2014, MNRAS, 443, 2766 [NASA ADS] [CrossRef] [Google Scholar]
- Cardelli, J. A., Clayton, G. C., & Mathis, J. S. 1989, ApJ, 345, 245 [Google Scholar]
- Compiègne, M., Verstraete, L., Jones, A., et al. 2011, A&A, 525, A103 [Google Scholar]
- Dartois, E., Geballe, T. R., Pino, T., et al. 2007, A&A, 463, 635 [NASA ADS] [CrossRef] [EDP Sciences] [Google Scholar]
- Donnan, F. R., Rigopoulou, D., García-Bernete, I., et al. 2023, A&A, 669, A87 [NASA ADS] [CrossRef] [EDP Sciences] [Google Scholar]
- Draine, B. T., & Li, A. 2007, ApJ, 657, 810 [CrossRef] [Google Scholar]
- Duley, W. W., & Williams, D. A. 1983, MNRAS, 205, 67 [Google Scholar]
- Esparza-Arredondo, D., González-Martín, O., Dultzin, D., et al. 2018, ApJ, 859, 124 [NASA ADS] [CrossRef] [Google Scholar]
- Falstad, N., Aalto, S., König, S., et al. 2021, A&A, 649, A105 [NASA ADS] [CrossRef] [EDP Sciences] [Google Scholar]
- Gao, J., Jiang, B. W., & Li, A. 2010, Earth Planets Space, 62, 63 [Google Scholar]
- García-Bernete, I., Rigopoulou, D., Aalto, S., et al. 2022a, A&A, 663, A46 [NASA ADS] [CrossRef] [EDP Sciences] [Google Scholar]
- García-Bernete, I., Rigopoulou, D., Alonso-Herrero, A., et al. 2022b, A&A, 666, L5 [NASA ADS] [CrossRef] [EDP Sciences] [Google Scholar]
- García-Bernete, I., Rigopoulou, D., Donnan, F. R., et al. 2024, A&A, 691, A162 [NASA ADS] [CrossRef] [EDP Sciences] [Google Scholar]
- García-Bernete, I., Donnan, F. R., Rigopoulou, D., et al. 2025, A&A, 696, A135 [NASA ADS] [CrossRef] [EDP Sciences] [Google Scholar]
- Gardner, J. P., Mather, J. C., Abbott, R., et al. 2023, PASP, 135, 068001 [NASA ADS] [CrossRef] [Google Scholar]
- Imanishi, M., & Dudley, C. C. 2000, ApJ, 545, 701 [NASA ADS] [CrossRef] [Google Scholar]
- Imanishi, M., Nakagawa, T., Ohyama, Y., et al. 2008, PASJ, 60, S489 [Google Scholar]
- Imanishi, M., Nakagawa, T., Shirahata, M., Ohyama, Y., & Onaka, T. 2010, ApJ, 721, 1233 [CrossRef] [Google Scholar]
- Ishihara, D., Onaka, T., Kataza, H., et al. 2010, A&A, 514, A1 [NASA ADS] [CrossRef] [EDP Sciences] [Google Scholar]
- Jensen, J. J., Hönig, S. F., Rakshit, S., et al. 2017, MNRAS, 470, 3071 [NASA ADS] [CrossRef] [Google Scholar]
- Jones, A. P., Fanciullo, L., Köhler, M., et al. 2013, A&A, 558, A62 [NASA ADS] [CrossRef] [EDP Sciences] [Google Scholar]
- Kondo, T., Kondo, A., Murata, K. L., et al. 2024, PASJ, 76, 1041 [Google Scholar]
- Kwok, S. 2007, Physics and Chemistry of the Interstellar Medium [Google Scholar]
- Kwok, S. 2012, Organic Matter in the Universe [Google Scholar]
- Kwok, S., & Zhang, Y. 2011, Nature, 479, 80 [NASA ADS] [CrossRef] [Google Scholar]
- Kwok, S., & Zhang, Y. 2013, ApJ, 771, 5 [NASA ADS] [CrossRef] [Google Scholar]
- Lai, T. S. Y., Armus, L., Bianchin, M., et al. 2023, ApJ, 957, L26 [NASA ADS] [CrossRef] [Google Scholar]
- LaMassa, S. M., Heckman, T. M., Ptak, A., et al. 2012, ApJ, 758, 1 [NASA ADS] [CrossRef] [Google Scholar]
- Li, A., & Draine, B. T. 2001, ApJ, 554, 778 [Google Scholar]
- Li, A., & Draine, B. T. 2012, ApJ, 760, L35 [NASA ADS] [CrossRef] [Google Scholar]
- Murakami, H., Baba, H., Barthel, P., et al. 2007, PASJ, 59, S369 [CrossRef] [Google Scholar]
- Neugebauer, G., Habing, H. J., van Duinen, R., et al. 1984, ApJ, 278, L1 [NASA ADS] [CrossRef] [Google Scholar]
- Onaka, T., Matsuhara, H., Wada, T., et al. 2007, PASJ, 59, S401 [Google Scholar]
- Oyabu, S., Ishihara, D., Malkan, M., et al. 2011, A&A, 529, A122 [NASA ADS] [CrossRef] [EDP Sciences] [Google Scholar]
- Polletta, M., Tajer, M., Maraschi, L., et al. 2007, ApJ, 663, 81 [NASA ADS] [CrossRef] [Google Scholar]
- Ramos Almeida, C., García-Bernete, I., Pereira-Santaella, M., et al. 2025, A&A, 698, A194 [NASA ADS] [CrossRef] [EDP Sciences] [Google Scholar]
- Rigopoulou, D., Donnan, F. R., García-Bernete, I., et al. 2024, MNRAS, 532, 1598 [NASA ADS] [CrossRef] [Google Scholar]
- Roche, P. F., Aitken, D. K., Smith, C. H., & Ward, M. J. 1991, MNRAS, 248, 606 [NASA ADS] [CrossRef] [Google Scholar]
- Sajina, A., Lacy, M., & Pope, A. 2022, Universe, 8, 356 [NASA ADS] [CrossRef] [Google Scholar]
- Sandford, S. A., Pendleton, Y. J., & Allamandola, L. J. 1995, ApJ, 440, 697 [Google Scholar]
- Sandstrom, K. M., Koch, E. W., Leroy, A. K., et al. 2023, ApJ, 944, L8 [NASA ADS] [CrossRef] [Google Scholar]
- Sloan, G. C., Bregman, J. D., Geballe, T. R., Allamandola, L. J., & Woodward, E. 1997, ApJ, 474, 735 [NASA ADS] [CrossRef] [Google Scholar]
- Smith, J. D. T., Draine, B. T., Dale, D. A., et al. 2007, ApJ, 656, 770 [Google Scholar]
- Stierwalt, S., Armus, L., Surace, J. A., et al. 2013, ApJS, 206, 1 [Google Scholar]
- Tielens, A. G. G. M. 2005, The Physics and Chemistry of the Interstellar Medium [Google Scholar]
- Tielens, A. G. G. M. 2008, ARA&A, 46, 289 [NASA ADS] [CrossRef] [Google Scholar]
- Voit, G. M. 1992, MNRAS, 258, 841 [NASA ADS] [CrossRef] [Google Scholar]
- Wright, E. L., Eisenhardt, P. R. M., Mainzer, A. K., et al. 2010, AJ, 140, 1868 [Google Scholar]
- Yamada, R., Oyabu, S., Kaneda, H., et al. 2013, PASJ, 65, 103 [NASA ADS] [Google Scholar]
- Yamagishi, M., Kaneda, H., Ishihara, D., et al. 2012, A&A, 541, A10 [NASA ADS] [CrossRef] [EDP Sciences] [Google Scholar]
All Tables
All Figures
|
Fig. 1 Examples of the spectral fitting results for the AKARI/IRC rest frame 2.5-4.2 μm spectra of AGN-dominated and AGN-SF-composite galaxies. The top two rows show examples of the cases where the aliphatic hydrocarbon features are detected in the emission, while the bottom two rows show those detected in the absorption. A black line shows the total model spectrum, while red and blue lines correspond to the aromatic and aliphatic hydrocarbon features, respectively. |
| In the text | |
|
Fig. 2 Examples of the SED fitting results for the same galaxies as in Fig. 1. A black line shows the total model spectrum, while a red line corresponds to the continuum emitted by hot dust. Grey lines show the stellar continuum, neutral and ionized PAHs, the continua emitted by warm dust components, and the continua emitted by SamC, LamC, and aSil, respectively, from short to long wavelengths. Black circles and blue squares represent the fluxes observed in the respective bands and predicted by the model SED, respectively. |
| In the text | |
|
Fig. 3 Same as Fig. 2 but the SEDs were fit with a model containing AGN template spectra (see text for details). |
| In the text | |
|
Fig. 4 Scatter plot of Laromatic/LIR as a function of LIR for the AGN-dominated (red circles) and AGN-SF-composite galaxies (red triangles). The gray circles show the relationship for the SFG sample. |
| In the text | |
|
Fig. 5 (a) Same as Fig. 4 but color coded separately for the aliphatic feature detected in the emission (red) and in the absorption (blue). (b) Scatter plot of τ3.41 as a function of LIR for the AGN sample. |
| In the text | |
|
Fig. 6 (a) Same as Fig. 5a but plotted as a function of LAGN/LIR for the AGN sample. (b) Same as Fig. 5a, but Laromatic/LIR is replaced with Laromatic/(LIR - LAGN) and plotted for the AGN-dominated galaxies. |
| In the text | |
|
Fig. 7 Scatter plots of Laliphatic/LIR as functions of (a) LIR and (b) LAGN/LIR for the AGN-dominated (red circles) and AGN-SF-composite galaxies (red triangles). The gray circles in panel a show the relationship for the SFG sample. |
| In the text | |
|
Fig. 8 Scatter plot of Laliphatic/Laromatic as a function of LIR for the AGN-dominated (red circles) and AGN-SF-composite galaxies (red triangles). The gray circles show the relationship for the SFG sample. |
| In the text | |
|
Fig. 9 (a) Relationship between τ3.41 and τ3.1 (H2O ice) for the AGN-dominated (circles) and the AGN-SF-composite galaxies (triangles), both with the a-C:H absorption features. (b) Same as Fig. 8 but corrected for the a-C:H absorption that is estimated from the τ3.41-τ3.1 relation in panel (a). The thick error bars correspond to the systematic errors (see text for details). |
| In the text | |
|
Fig. 10 Scatter plots of Laromatic/Laliphatic as functions of (a) LAGN/LIR and (b) EWPAH for the AGN-dominated (red circles) and the AGN-SF-composite galaxies (red triangles). The gray circles in panel (b) show the relationship for the SFG sample. |
| In the text | |
|
Fig. 11 AKARI/IRC 3.15-3.65 μm stacked spectra of the AGN samples with LAGN/LIR > 0.4 (red) and LAGN/LIR < 0.4 (blue). |
| In the text | |
|
Fig. 12 Relationship between the sum of the luminosities of the three aliphatic sub-components (L3.46 + L3.51 + L3.56) and the luminosity of the aliphatic 3.41 μm sub-component (L3.41) for the AGN-dominated (red circles) and AGN-SF-composite galaxies (red triangles). The gray circles show the relationship for the SFG sample, where the dashed line is the best fit to the data points. The solid line is the relationship between τ3.46 + τ3.51 + τ3.56 and τ3.41 obtained for the stacked spectrum of the a-C:H absorption AGN sample shown in Fig. 13b. |
| In the text | |
|
Fig. 13 AKARI/IRC 3.2-3.65 μm stacked spectra of the AGN sample. (a) Aliphatic emission and (b) a-C:H absorption features, where the continuum emission, the 3.3 μm aromatic hydrocarbons emission feature, and the H2O ice absorption feature are removed, i.e., Faliphatic and τaliphatic in equations (1) and (2). (c) Difference between their profiles. |
| In the text | |
|
Fig. 14 Scatter plot of the relative strength of the aliphatic subcomponents (L3.46 + L3.51 + L3.56)/L3.41 as a function of Laliphatic/Laromatic for the AGN-dominated (red circles) and AGN-SF-composite galaxies (red triangles). The gray circles show the relationship for the SFG sample. The blue star marks show the mean values of the IRGs and the ULIRGs for the SFG sample. |
| In the text | |
Current usage metrics show cumulative count of Article Views (full-text article views including HTML views, PDF and ePub downloads, according to the available data) and Abstracts Views on Vision4Press platform.
Data correspond to usage on the plateform after 2015. The current usage metrics is available 48-96 hours after online publication and is updated daily on week days.
Initial download of the metrics may take a while.