Fig. 2
Download original image
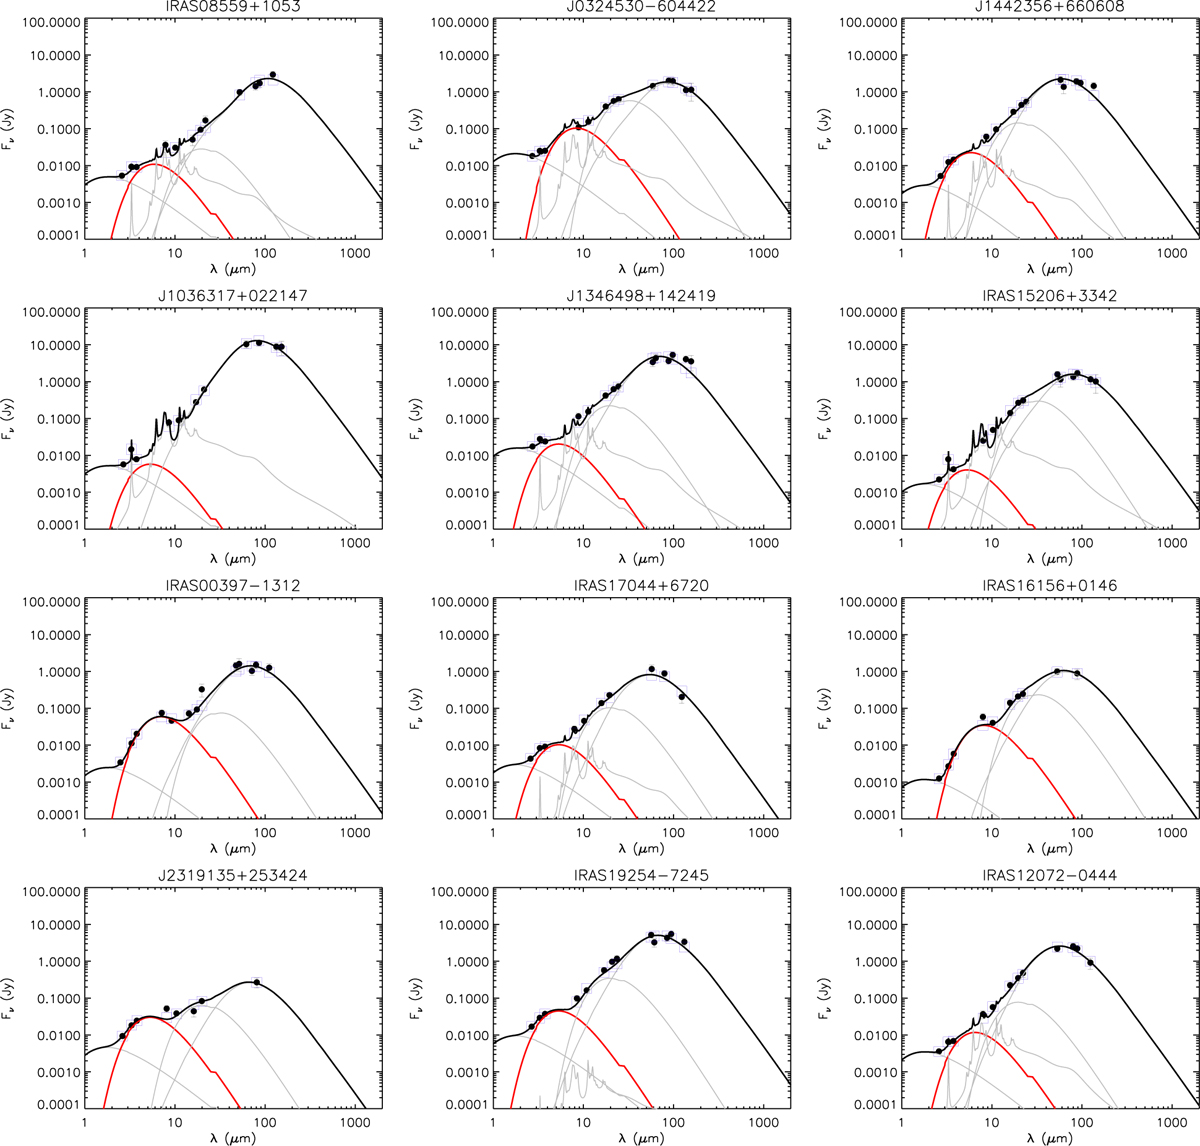
Examples of the SED fitting results for the same galaxies as in Fig. 1. A black line shows the total model spectrum, while a red line corresponds to the continuum emitted by hot dust. Grey lines show the stellar continuum, neutral and ionized PAHs, the continua emitted by warm dust components, and the continua emitted by SamC, LamC, and aSil, respectively, from short to long wavelengths. Black circles and blue squares represent the fluxes observed in the respective bands and predicted by the model SED, respectively.
Current usage metrics show cumulative count of Article Views (full-text article views including HTML views, PDF and ePub downloads, according to the available data) and Abstracts Views on Vision4Press platform.
Data correspond to usage on the plateform after 2015. The current usage metrics is available 48-96 hours after online publication and is updated daily on week days.
Initial download of the metrics may take a while.