Fig. 2.
Download original image
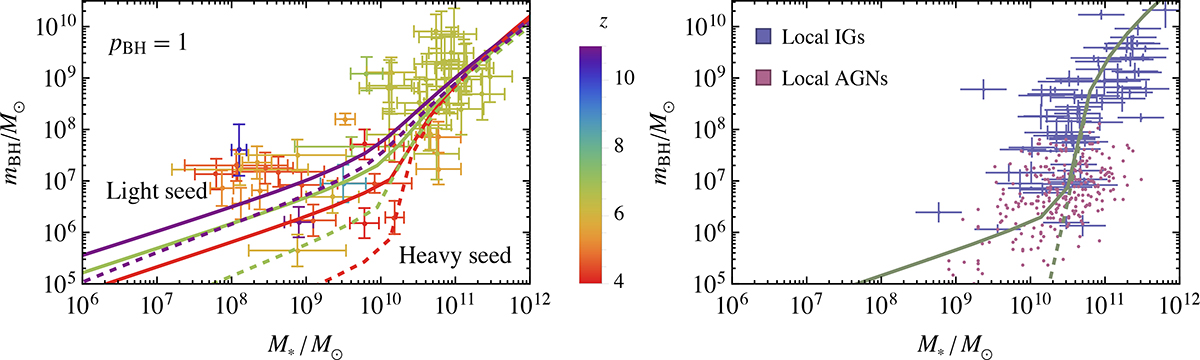
Comparisons of model predictions for stellar mass-BH mass relation with high-z observations on the left and low-z observations on the right. The solid lines show the evolution of light seeds (mseed = 100 M⊙ with Mseed = 3 × 10⁴ M⊙), and dashed lines show the evolution of heavy seeds (mseed = 105 M⊙ with Mseed = 3 × 10⁷ M⊙), both for pBH = 1. The right panel shows the predictions of the same two models at z ≈ 0 as full and dashed lines, respectively, compared to the local observations.
Current usage metrics show cumulative count of Article Views (full-text article views including HTML views, PDF and ePub downloads, according to the available data) and Abstracts Views on Vision4Press platform.
Data correspond to usage on the plateform after 2015. The current usage metrics is available 48-96 hours after online publication and is updated daily on week days.
Initial download of the metrics may take a while.