Fig. 5.
Download original image
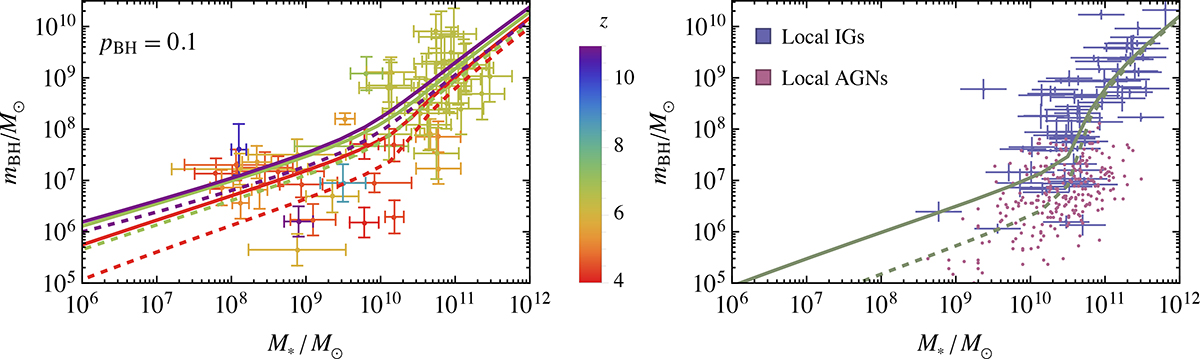
Comparisons of model predictions for stellar mass-BH mass relation with high-z observations on the left and with low-z observations on the right. The solid lines show the best fit for pBH = 0.1 to the JWST data, and the dashed lines show the best fit to the rest of the SMBH data. The best-fit parameter values are given in Table 1.
Current usage metrics show cumulative count of Article Views (full-text article views including HTML views, PDF and ePub downloads, according to the available data) and Abstracts Views on Vision4Press platform.
Data correspond to usage on the plateform after 2015. The current usage metrics is available 48-96 hours after online publication and is updated daily on week days.
Initial download of the metrics may take a while.