Fig. 1.
Download original image
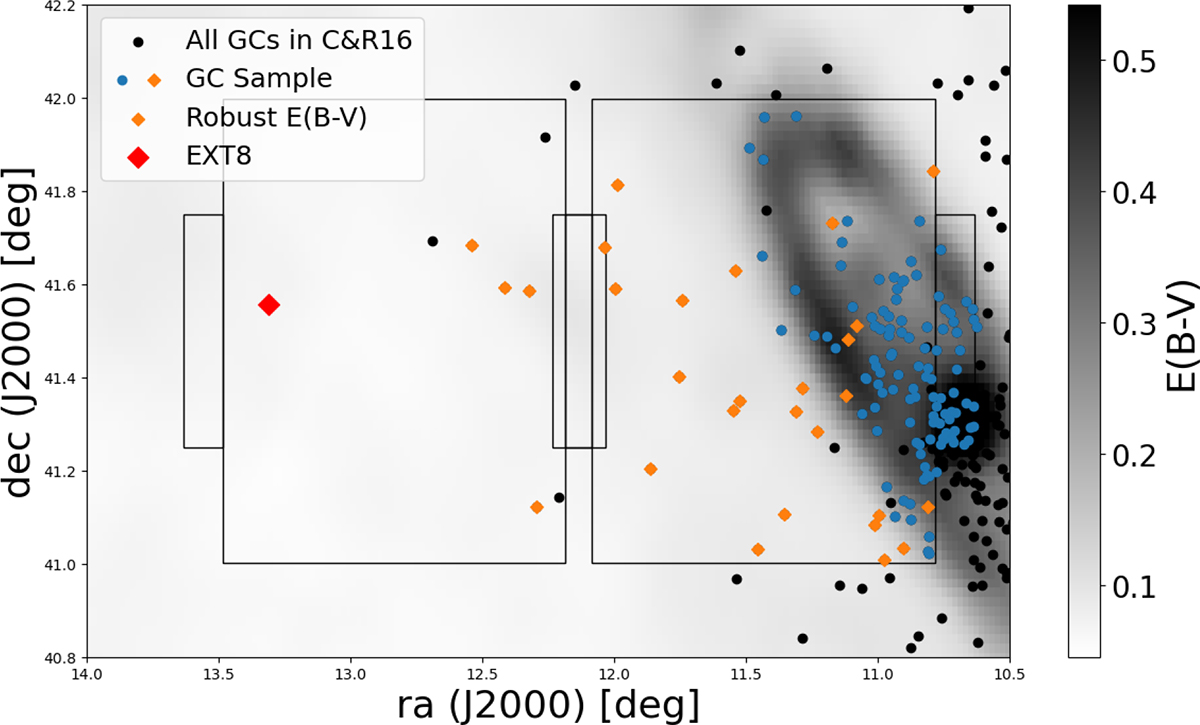
Observational footprint of this study. The GC sample is marked with either orange diamonds or blue circles, signifying GCs with and without robust reddening estimates. EXT8 is marked in red, and the black circles are confirmed M31 GCs from the C&R16 catalogue that were not considered. The background colour is the reddening from the Schlegel et al. (1998) dust map with the correction of Schlafly et al. (2010), clearly highlighting M31 itself. The two rectangles with ‘ears’ are the observed fields that form the footprint for this study.
Current usage metrics show cumulative count of Article Views (full-text article views including HTML views, PDF and ePub downloads, according to the available data) and Abstracts Views on Vision4Press platform.
Data correspond to usage on the plateform after 2015. The current usage metrics is available 48-96 hours after online publication and is updated daily on week days.
Initial download of the metrics may take a while.