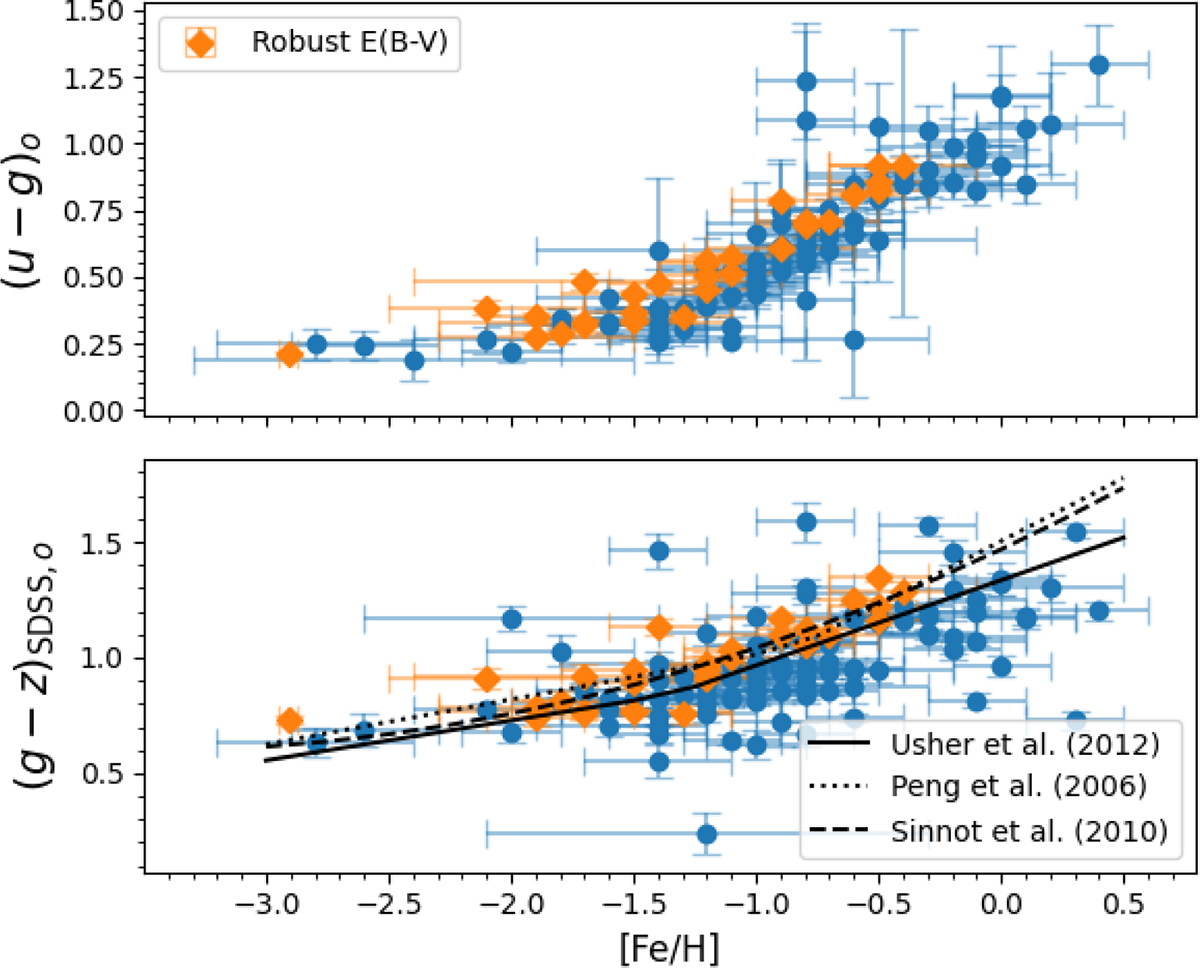
Fig. 5.
Download original image
Broadband colours, (u − g)o (top) and (g − z)SDSS, o (bottom), plotted against metallicity for our GC sample. For (g − z)SDSS, o, the spectroscopically calibrated CMRs from Peng et al. (2006, dotted), Sinnott et al. (2010, dashed), and Usher et al. (2012, solid) are also plotted. For both colours, the GCs below the metallicity do not separate clearly from other GCs.
Current usage metrics show cumulative count of Article Views (full-text article views including HTML views, PDF and ePub downloads, according to the available data) and Abstracts Views on Vision4Press platform.
Data correspond to usage on the plateform after 2015. The current usage metrics is available 48-96 hours after online publication and is updated daily on week days.
Initial download of the metrics may take a while.