Fig. 6.
Download original image
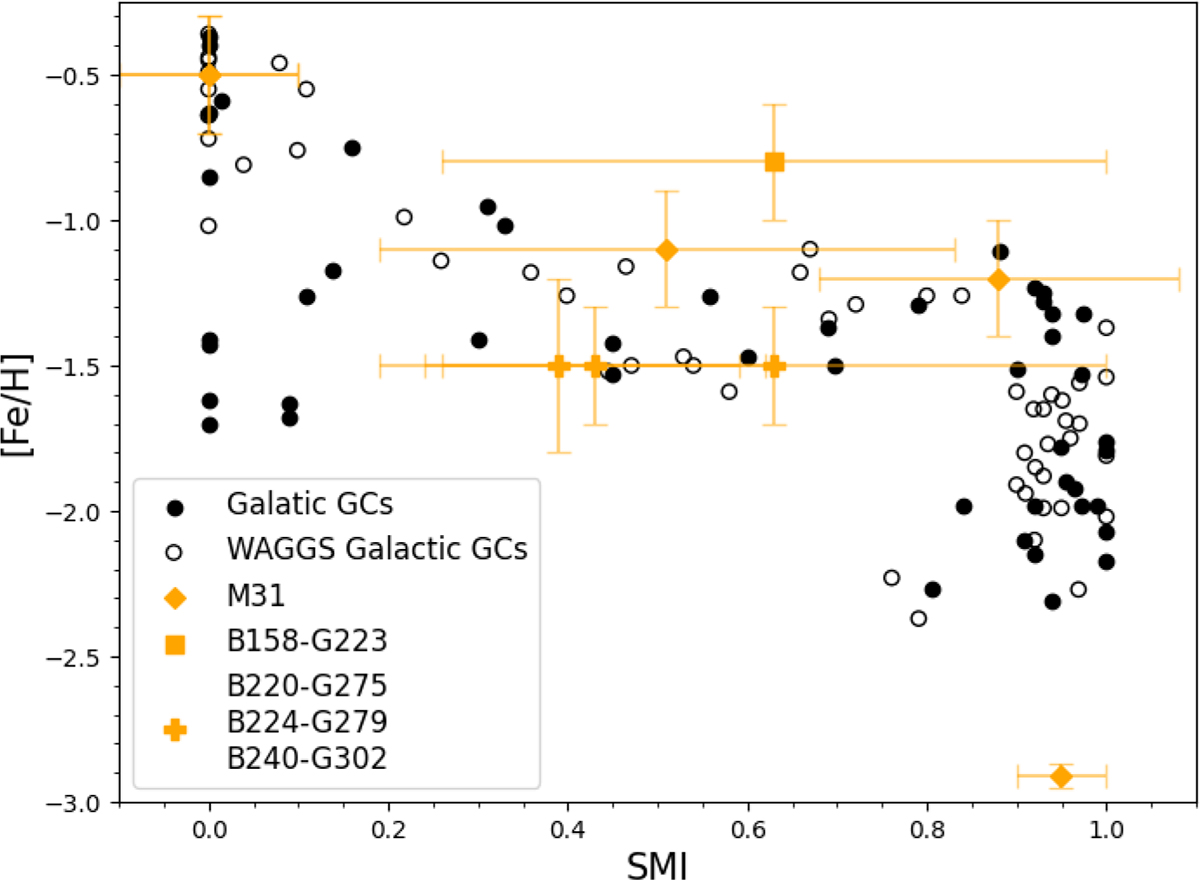
SMI vs metallicity diagram. The nine M31 GCs are plotted in orange. The GGCs are plotted as black circles. The SMI for the GGCs is a combination of data from Perina et al. (2012) and Lee et al. (1994). The Lee et al. (1994) HB ratio values were converted to SMI using the Preston et al. (1991) relation. The GGC metallicities were taken from Harris (1996, 2010 edition) The GGCs that have WAGGS spectra (Usher et al. 2017) are shown as open black circles.
Current usage metrics show cumulative count of Article Views (full-text article views including HTML views, PDF and ePub downloads, according to the available data) and Abstracts Views on Vision4Press platform.
Data correspond to usage on the plateform after 2015. The current usage metrics is available 48-96 hours after online publication and is updated daily on week days.
Initial download of the metrics may take a while.