Fig. 10
Download original image
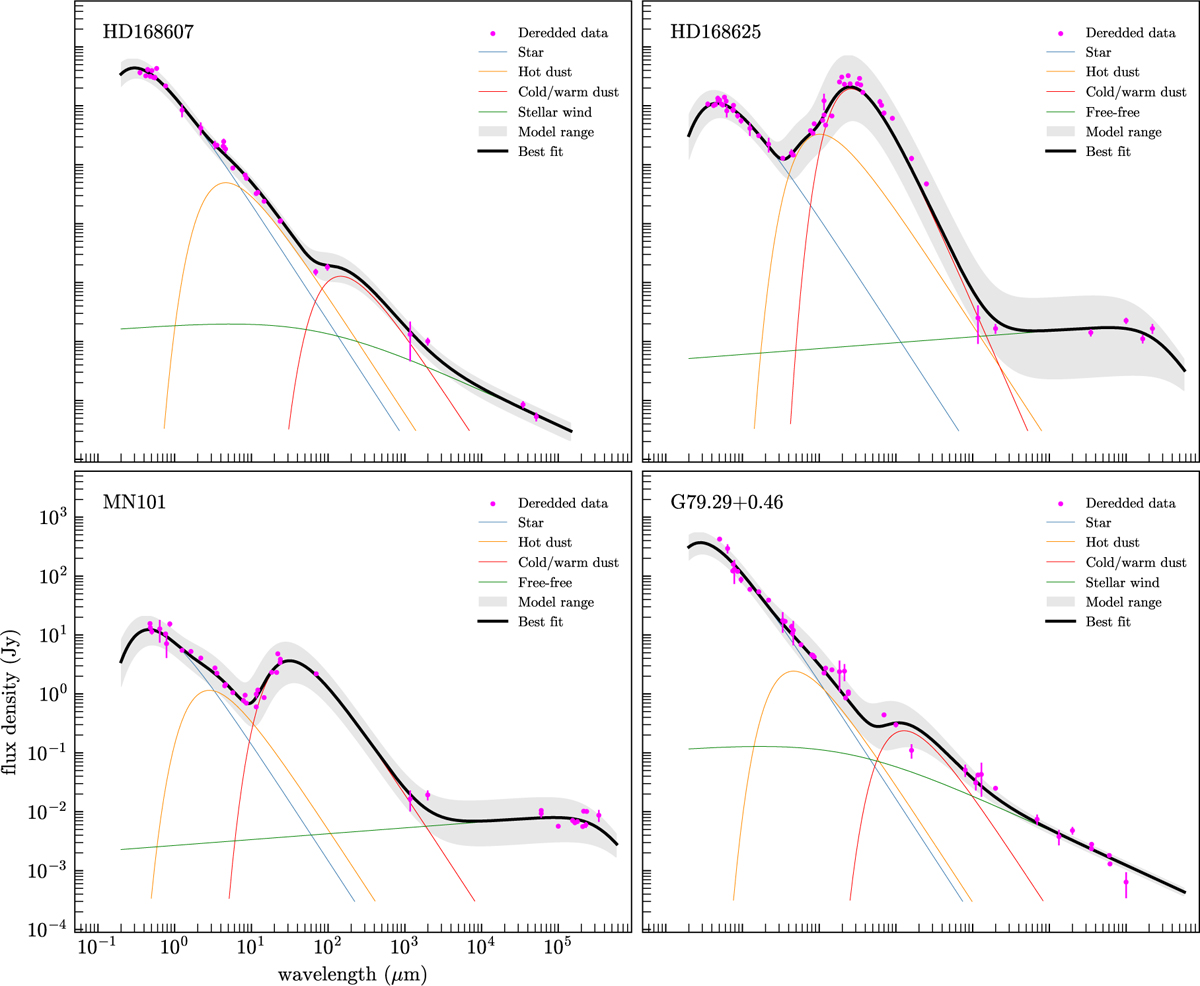
Best-fit models. The target names are indicated in the top left corners of each panel. Individual components (star, hot dust, warm or cold dust, and stellar wind or Bremsstrahlung) are indicated by the blue, orange, red, and green lines, respectively. The combination of the models (best fit) are shown in bold black lines. The grey area encloses the combined uncertainties of the fitting. The magenta dots with error bars depict the de-reddened photometry. The four charts are depicted with the same wavelength and flux density scales to facilitate the comparison among the targets.
Current usage metrics show cumulative count of Article Views (full-text article views including HTML views, PDF and ePub downloads, according to the available data) and Abstracts Views on Vision4Press platform.
Data correspond to usage on the plateform after 2015. The current usage metrics is available 48-96 hours after online publication and is updated daily on week days.
Initial download of the metrics may take a while.