Fig. 2
Download original image
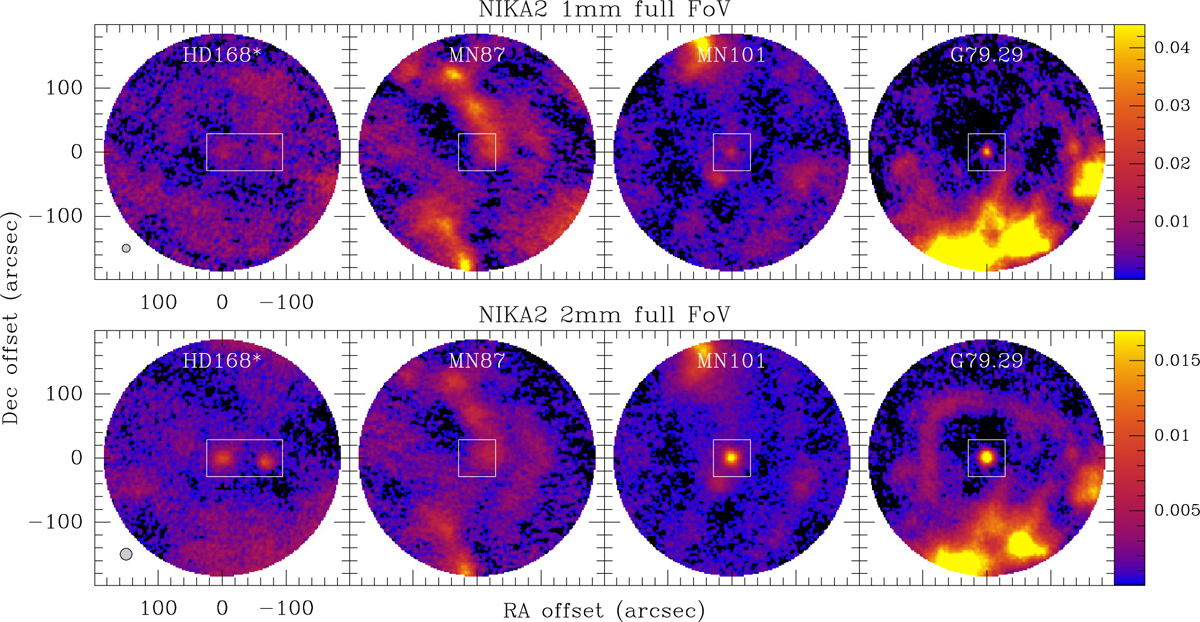
Sky maps of the millimetre continuum emission in the four fields observed with NIKA2. The maps at 1.15 mm are shown at the top row, and the 2 mm maps are shown at the bottom. The field that contains HD 168607 and HD 168625, labelled HD168*, is centred on HD 168625. The colour scales (indicated at the right of each row) are in Jy beam−1. HPBWs are drawn near the bottom left corners of the HD168* images. The central areas indicate the zoomed region displayed in Fig. 3.
Current usage metrics show cumulative count of Article Views (full-text article views including HTML views, PDF and ePub downloads, according to the available data) and Abstracts Views on Vision4Press platform.
Data correspond to usage on the plateform after 2015. The current usage metrics is available 48-96 hours after online publication and is updated daily on week days.
Initial download of the metrics may take a while.