Fig. 3
Download original image
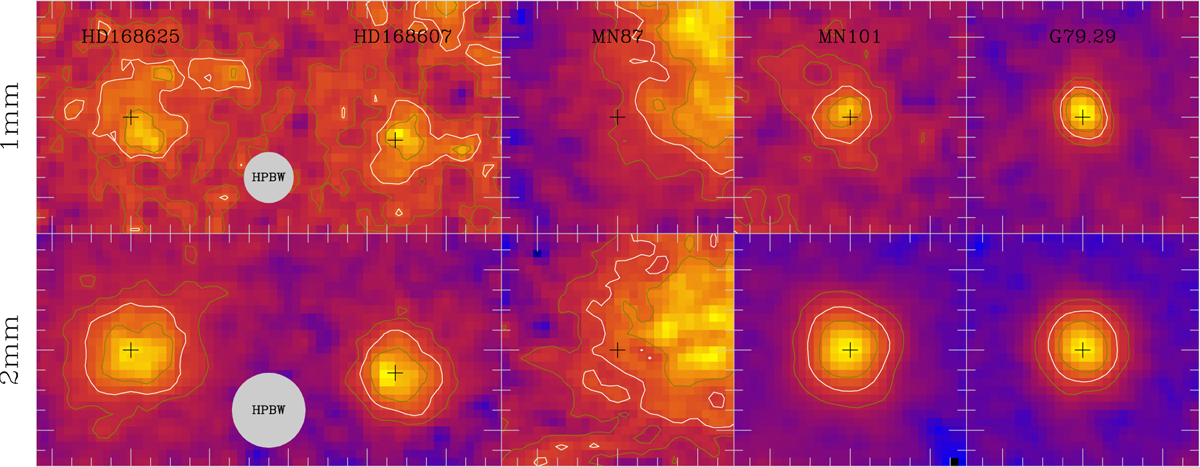
Zoomed sky maps around the central sources. The regions correspond to the regions indicated in Fig. 2. To span the full dynamic range, the colour scale is different for each of the maps. The contours correspond to 30, 50 (highlighted in white), and 70% of the maximum value. HPBWs are indicated near the bottom of the HD168* images. The contours at 50% are highlighted to facilitate a visual comparison with the beam and give an idea about the point-like nature of the central sources.
Current usage metrics show cumulative count of Article Views (full-text article views including HTML views, PDF and ePub downloads, according to the available data) and Abstracts Views on Vision4Press platform.
Data correspond to usage on the plateform after 2015. The current usage metrics is available 48-96 hours after online publication and is updated daily on week days.
Initial download of the metrics may take a while.