Fig. 4.
Download original image
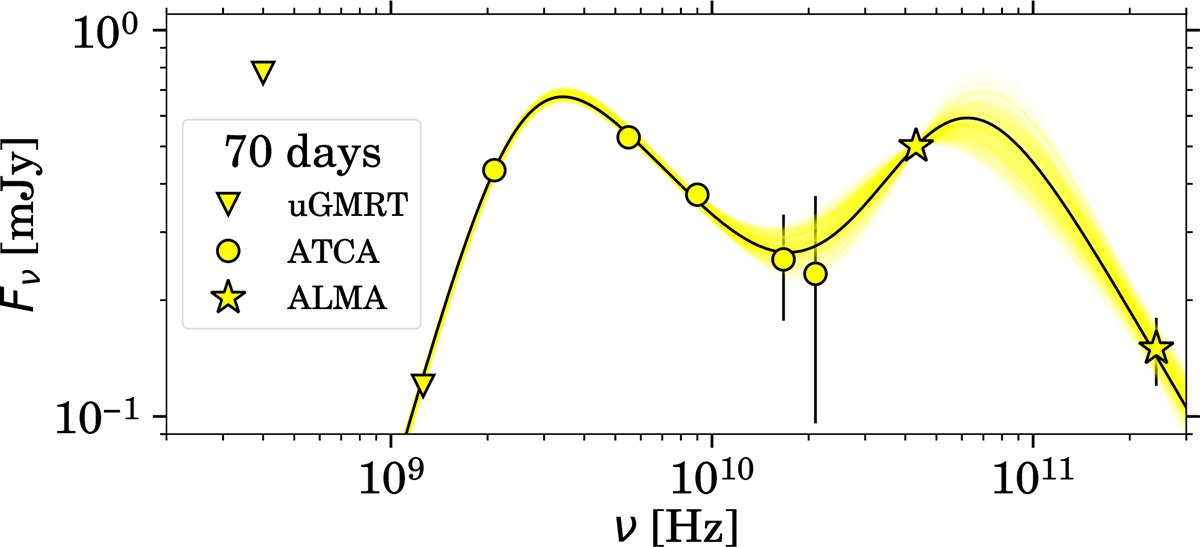
EP241021a radio spectrum at 70 days. The 5 sigma upper limits from uGMRT are represented as triangles; ATCA observations are represented with dots; and ALMA observations are represented with stars. The spectra are fit with a broken power-law model, the colored regions represent the 500 highest-likelihood fits, while the black line represents the best fit.
Current usage metrics show cumulative count of Article Views (full-text article views including HTML views, PDF and ePub downloads, according to the available data) and Abstracts Views on Vision4Press platform.
Data correspond to usage on the plateform after 2015. The current usage metrics is available 48-96 hours after online publication and is updated daily on week days.
Initial download of the metrics may take a while.