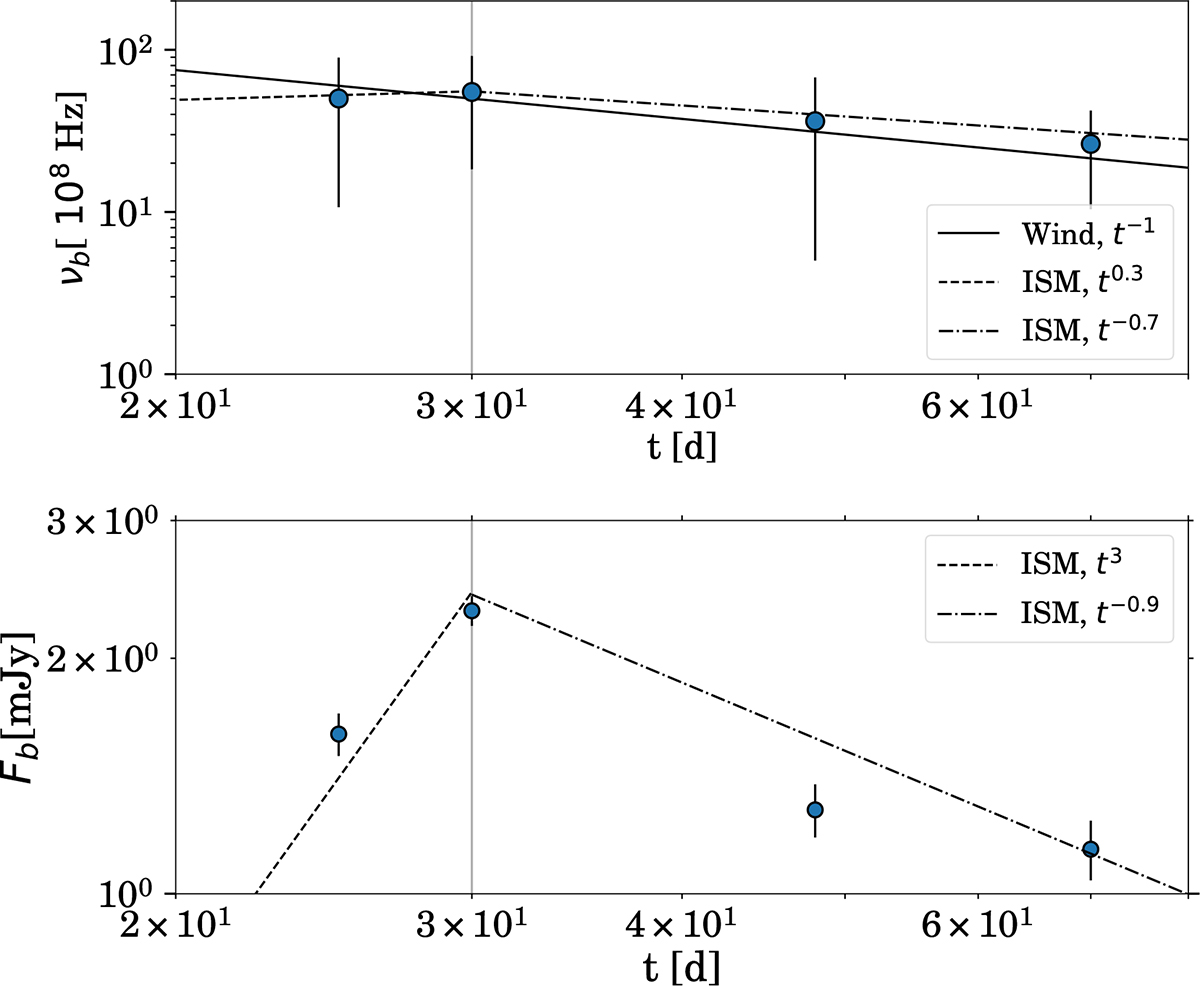
Fig. 5.
Download original image
Top panel: Break frequency resulting from the fit as a function of time. The expected behavior is overplotted with a solid line in the case of a wind environment and with dashed and dot-dashed lines in the case of ISM. The vertical shaded line represents the assumed deceleration time. Bottom panel: Peak flux in the spectra as a function of time. The expected behavior as a function of time for the wind environment is constant, while that for the ISM is plotted in dashed lines.
Current usage metrics show cumulative count of Article Views (full-text article views including HTML views, PDF and ePub downloads, according to the available data) and Abstracts Views on Vision4Press platform.
Data correspond to usage on the plateform after 2015. The current usage metrics is available 48-96 hours after online publication and is updated daily on week days.
Initial download of the metrics may take a while.