Fig. 6.
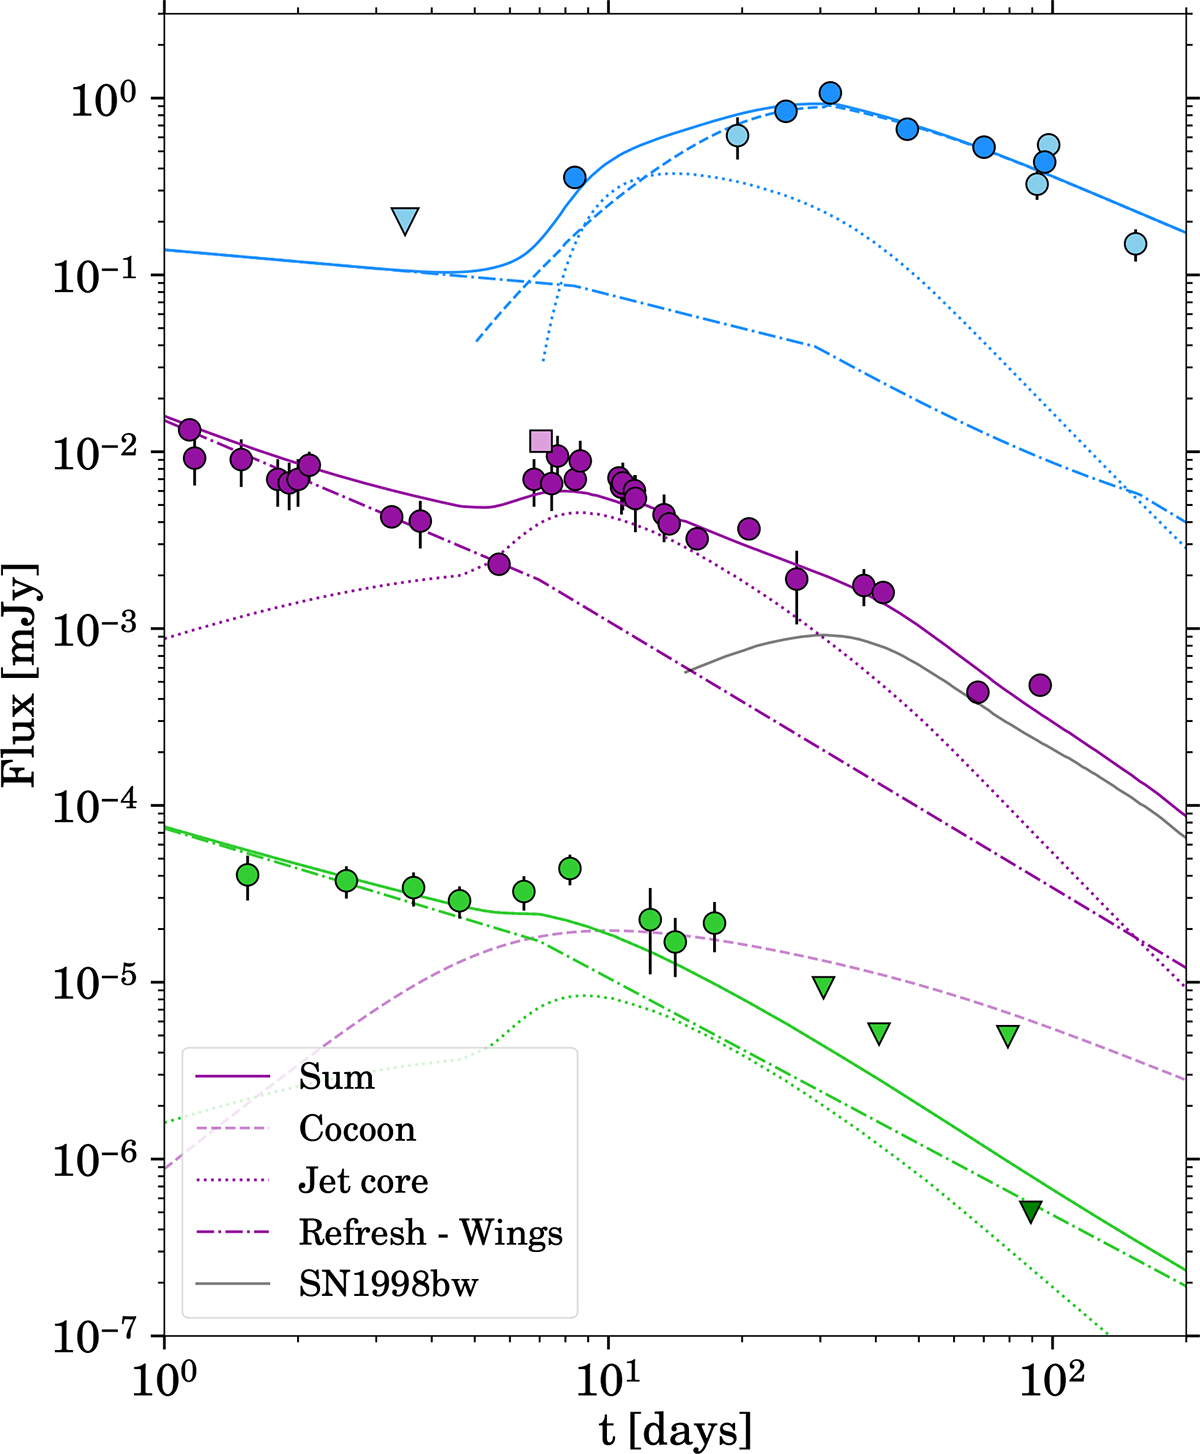
Download original image
EP241021a broadband light curve modeling. The dataset is shown as in Fig. 1, with the addition of the dark green upper limit at ∼89 d from XMM Newton, reported in Shu et al. (2025). The solid line represents the sum of an early refreshing phase (the wings of the jet, dot dashed line), the jet’s off-axis core (dotted line), and a cocoon (dashed line). In the optical band, the expected emission of SN1998bw (shaded black line) is also included in the sum. The cocoon emission is mainly relevant for the radio band. The optical light curve is represented in the plot, while the X-ray light curve has a peak flux of ∼2 × 10⁻⁸ mJy.
Current usage metrics show cumulative count of Article Views (full-text article views including HTML views, PDF and ePub downloads, according to the available data) and Abstracts Views on Vision4Press platform.
Data correspond to usage on the plateform after 2015. The current usage metrics is available 48-96 hours after online publication and is updated daily on week days.
Initial download of the metrics may take a while.