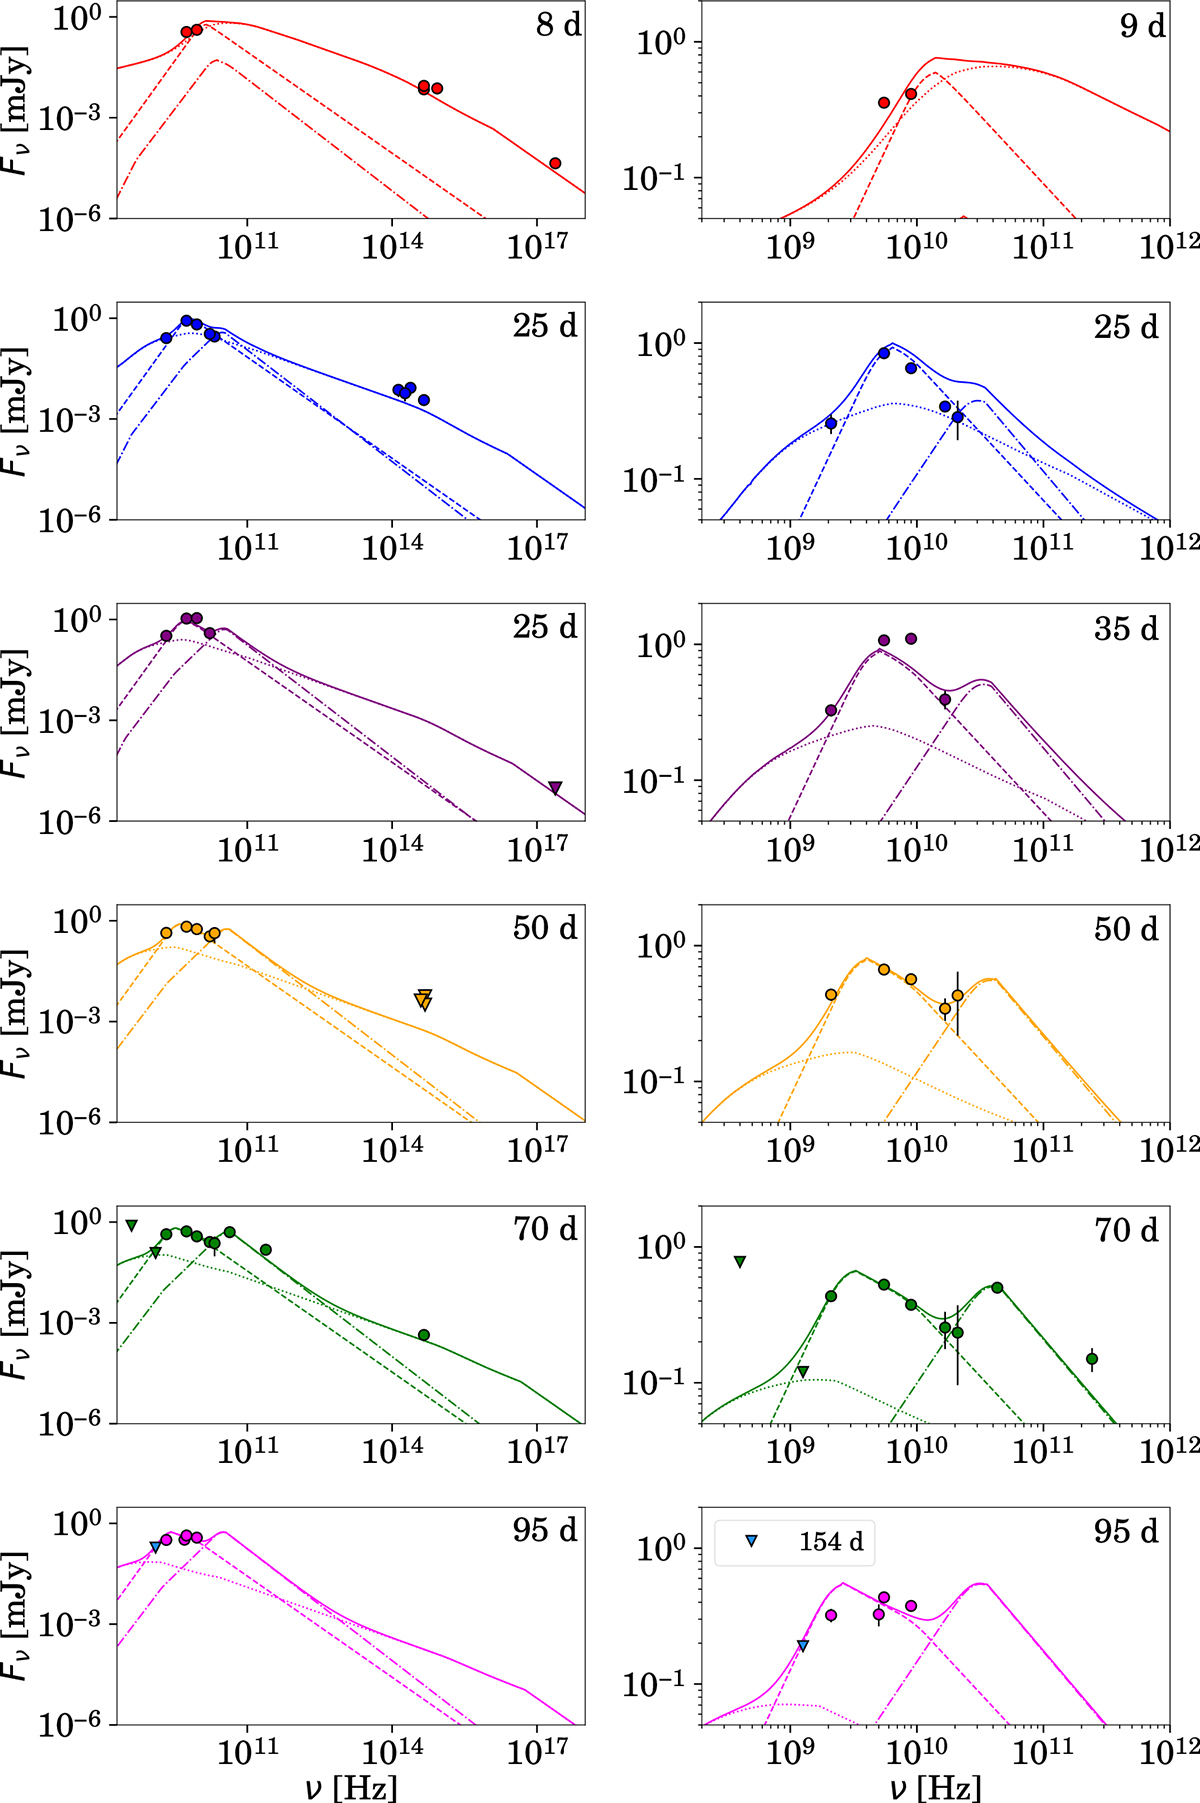
Fig. 8.
Download original image
EP241021a spectra at different times, up to 95 days. The broadband spectrum is represented in the first column, while a zoom of the radio spectrum is represented in the second column. The observation date is shown in the top right of each plot. The solid line represents the sum of all the components: the relativistic jet producing the optical and X-ray emission (in dotted line), the main cocoon emission producing the radio data (dashed lines), and the cocoon producing the ALMA data (dot-dashed lines). In the last two panels, the blue upper limit refers to the u-GMRT observation at ∼154 days, while the other data points refer to those taken at ∼95 days.
Current usage metrics show cumulative count of Article Views (full-text article views including HTML views, PDF and ePub downloads, according to the available data) and Abstracts Views on Vision4Press platform.
Data correspond to usage on the plateform after 2015. The current usage metrics is available 48-96 hours after online publication and is updated daily on week days.
Initial download of the metrics may take a while.