Fig. B.1.
Download original image
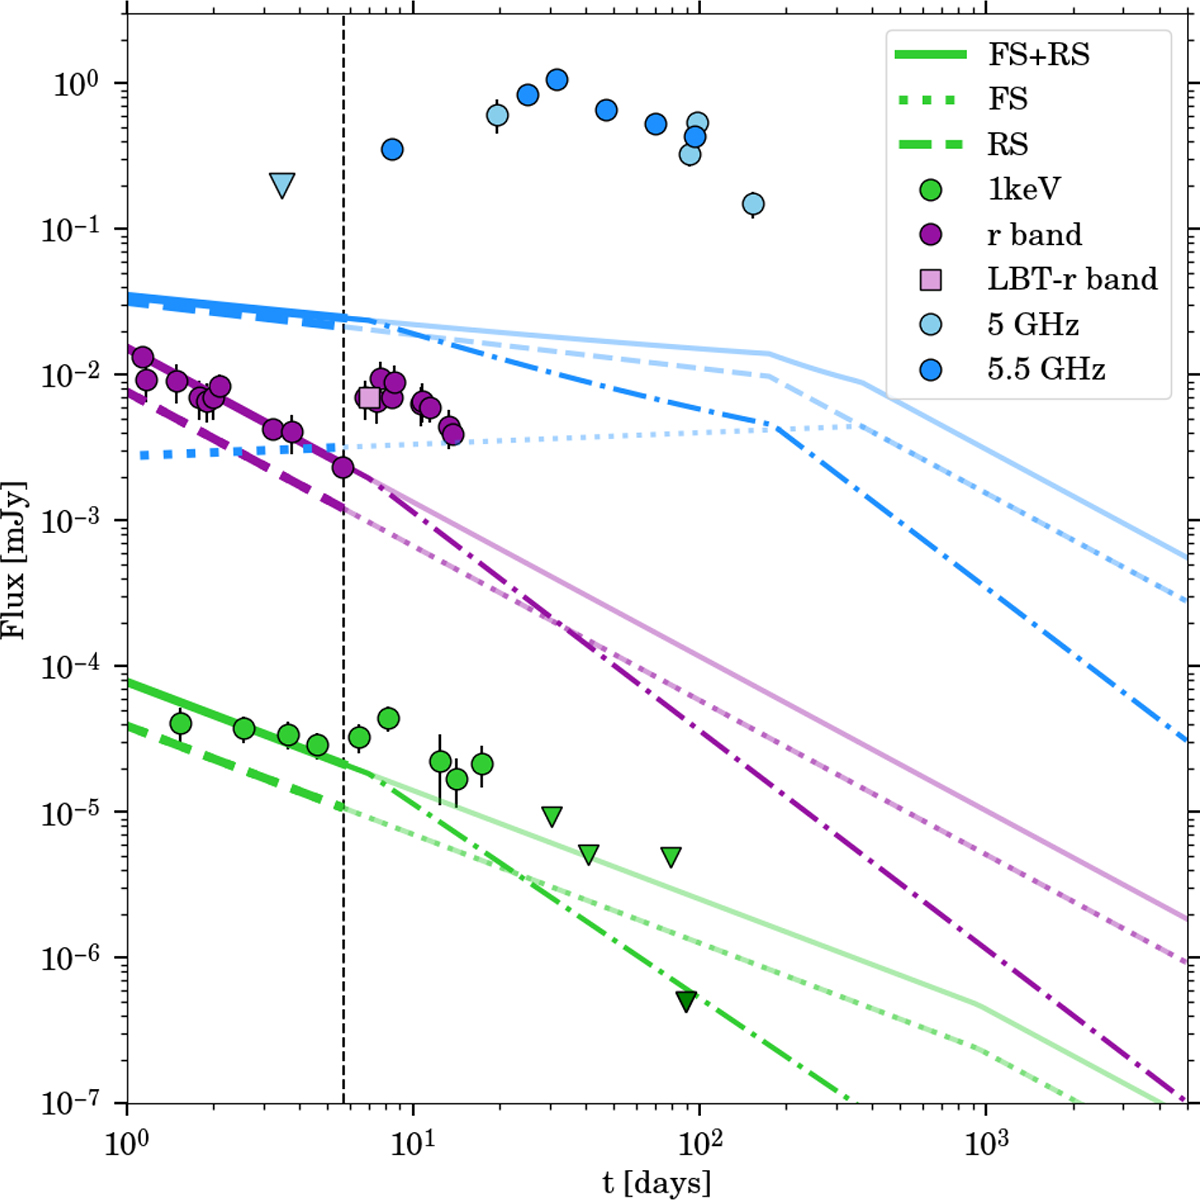
EP241021a broadband light curve. The dashed line represents the contribution of the RS, the dotted line represents the contribution of the FS, while the solid line represents the sum of FS and RS. The FS and RS are superimposed in the optical and X-ray bands. The data points before the vertical dashed line are fit, and the model following that is an interpolation, assuming that the refreshing phase continues up to 5 × 10³ days. The dot-dashed line represents the model interpolation when the refreshing phase ends at 10 days. The dark green X-ray upper limit at 89 d is derived from Shu et al. 2025.
Current usage metrics show cumulative count of Article Views (full-text article views including HTML views, PDF and ePub downloads, according to the available data) and Abstracts Views on Vision4Press platform.
Data correspond to usage on the plateform after 2015. The current usage metrics is available 48-96 hours after online publication and is updated daily on week days.
Initial download of the metrics may take a while.