Fig. 1.
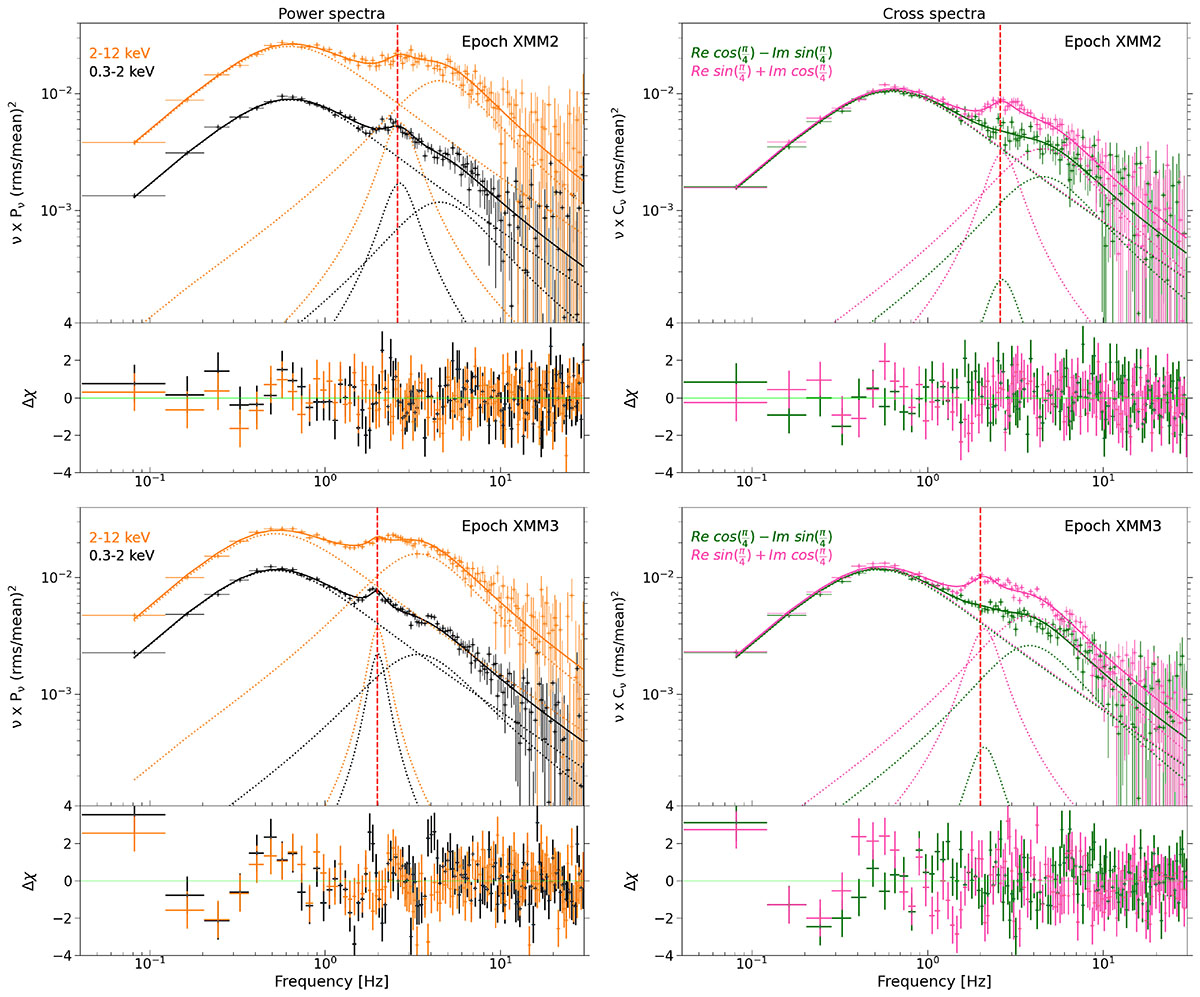
Download original image
Left panel: Power spectra of the second (top) and third (bottom) EPIC-PN observations of Swift J1727.8−1613 in the 0.3−2 keV (black) and 2−12 keV (orange) energy bands. Right panel: Real (green) and imaginary (pink) parts of the cross spectra of the same two observations using the 0.3−2 keV and 2−12 keV energy bands, rotated by 45° (see Sect. 3.2 for more details). The vertical red line shows the position of the central frequency ν0 of the imaginary QPO. The total model is shown with the continuous line, and the individual Lorentzians are shown as dotted lines. The residuals defined as Δχ = (data–model)/error are plotted below each fit.
Current usage metrics show cumulative count of Article Views (full-text article views including HTML views, PDF and ePub downloads, according to the available data) and Abstracts Views on Vision4Press platform.
Data correspond to usage on the plateform after 2015. The current usage metrics is available 48-96 hours after online publication and is updated daily on week days.
Initial download of the metrics may take a while.