| Issue |
A&A
Volume 703, November 2025
|
|
|---|---|---|
| Article Number | A257 | |
| Number of page(s) | 9 | |
| Section | Astrophysical processes | |
| DOI | https://doi.org/10.1051/0004-6361/202555486 | |
| Published online | 19 November 2025 | |
Detection of a type-C quasi-periodic oscillation during the soft-to-hard transition in Swift J1727.8–1613
1
Astronomical Institute of the Czech Academy of Sciences, Boční II 1401/1, 14100 Prague 4, Czech Republic
2
Astronomical Institute, Faculty of Mathematics and Physics, Charles University, V Holešovičkách 2, Prague 8 18000, Czech Republic
3
Department of Physics, University of Warwick, Gibbet Hill Road, Coventry CV4 7AL, UK
4
Instituto Argentino de Radioastronomía (CCT La Plata, CONICET; CICPBA; UNLP), C.C.5, (1894), Villa Elisa, Buenos Aires, Argentina
5
Facultad de Ciencias Astronómicas y Geofísicas, Universidad Nacional de La Plata, Paseo del Bosque, B1900FWA La Plata, Argentina
6
ESO, Karl-Schwarzschild-Strasse 2, 85748 Garching bei München, Germany
7
Kapteyn Astronomical Institute, University of Groningen, PO BOX 800 Groningen NL-9700 AV, The Netherlands
8
INAF Istituto di Astrofisica e Planetologia Spaziali, Via del Fosso del Cavaliere 100, I-00133 Roma, Italy
9
Department of Physics and Astronomy, University of Southampton, Highfield, Southampton SO17 1BJ, UK
10
Institute of Astronomy, University of Cambridge, Madingley Road, Cambridge CB3 0HA, UK
11
School of Physics and Astronomy, University of Southampton, Highfield, Southampton SO17 1BJ, UK
⋆ Corresponding author: This email address is being protected from spambots. You need JavaScript enabled to view it.
Received:
12
May
2025
Accepted:
17
September
2025
Abstract
Context. Timing analysis of accreting systems is key to probing the structure and dynamics around compact objects. In black-hole low-mass X-ray binaries (BH LMXBs), the compact object accretes matter from a low-mass companion star via Roche-Lobe overflow and forms an accretion disk that occasionally exhibits bright eruptions. The BH LMXB Swift J1727.8−1613 (hereafter J1727) underwent one of the brightest outbursts ever recorded in X-rays in August 2023.
Aims. We study the timing properties of J1727 in the decaying phase of its outburst based on XMM–Newton data with a high-time resolution.
Methods. We analyzed the power spectrum (PS) and cross spectrum (CS) of J1727, which we modeled with Lorentzians. The PS reveals the power distribution of the source across frequencies, and the real and imaginary parts of the CS compare the displacement of the light curves in different energy bands for the different observations. Finally, we simultaneously derived the phase lags and the coherence using a constant phase-lag model.
Results. While the first (soft-state) observation shows no strong variability, the two harder observations exhibit quasi-periodic oscillations (QPOs). Because the QPO is more significantly detected in the imaginary part of the CS than in the PS, we refer to it as the “imaginary QPO”. The QPO is more prominent in the soft 0.3−2 keV band than in the hard 2−12 keV band. As the source evolves toward the hard state, the imaginary QPO shifts to lower frequencies, the broadband fractional rms amplitude in the 0.3−2 keV energy band increases, and the rms covariance of the imaginary QPO decreases. Simultaneously, the phase lags increase, and the coherence function drops at the imaginary QPO frequency.
Conclusions. This analysis provides the first type-C QPO detection in a BH XB during the soft–to–hard transition using XMM–Newton data. The QPO is detected at particularly low energy (0.3−2 keV). Notably, the QPO is significantly detected in the imaginary part of the CS and the PS. Thus, we confirm the physical origin of the coherence drop and the phase-lag excess, which were only observed with NICER before.
Key words: stars: black holes / X-rays: binaries / X-rays: individuals: Swift J1727.8–1613
© The Authors 2025
 Open Access article, published by EDP Sciences, under the terms of the Creative Commons Attribution License (https://creativecommons.org/licenses/by/4.0), which permits unrestricted use, distribution, and reproduction in any medium, provided the original work is properly cited.
This article is published in open access under the Subscribe to Open model. This email address is being protected from spambots. You need JavaScript enabled to view it. to support open access publication.
1. Introduction
Black hole low-mass X-ray binaries (BH LMXBs) consist of a black hole accreting matter from a low-mass companion star through Roche-Lobe overflow (Frank et al. 2002). Several of these sources display outbursts, during which their flux increases by a few orders of magnitude over a few weeks to months (Zdziarski et al. 2004; Done et al. 2007; Hirsch et al. 2020). The spectral and timing properties of these sources change dramatically throughout the outburst evolution and transition from the Hard state (HS) to the Soft state (SS; Remillard & McClintock 2006). In the HS, the emission from the hot Comptonized medium (often referred to as the “corona”) dominates the X-ray spectrum. In contrast, during the SS, a multiblackbody emission from the accretion disk dominates the high-energy spectrum (see Shakura & Sunyaev 1973). The transition between these two spectral states is often referred to as the hard-intermediate state (HIMS) and the soft-intermediate state (SIMS; Belloni et al. 2005). These states are far more rarely observed than the HS and the SS because their lifespan is short (Dunn et al. 2010). Swift J1727.8−1613 (hereafter J1727) is one of the few sources that were observed in the decaying phase of the outburst. First detected on August 24, 2023 (Dichiara et al. 2023; Negoro et al. 2023), the source emission peaked at around 7 Crab in the 2−20 keV energy band; this event was an exceptionally bright outburst. J1727 is the first BH LMXB that was observed with the Imaging X-ray Polarimetry Explorer (IXPE; Weisskopf et al. 2022) throughout the entire outburst, from the brightening in the hard state (Veledina et al. 2023) through the hard–to–soft transition (Ingram et al. 2024) to the soft state (Svoboda et al. 2024), and finally, in the dim hard state (Podgorný et al. 2024). Optical spectroscopy during quiescence suggests the presence of a black hole primary (Mata Sánchez et al. 2024), located at  kpc (Burridge et al. 2025), which defines the system as a low-mass X-ray binary (LMXB; Castro-Tirado et al. 2023).
Throughout the outburst, which is visible as a “q” shape in the hardness-intensity diagram (HID; e.g. Homan et al. 2001; Fender et al. 2004), transient BH XBs show fast X-ray variability. Quasi-periodic oscillations (QPOs; van der Klis 1989; Psaltis et al. 1999; Belloni et al. 2002; Giannios & Spruit 2004) are among the components that can be tracked during an outburst. They provide insight into the inner parts of the system. Low-frequency QPOs (LFQPOs) are the most commonly observed events. Their frequencies range from ≈0.01 Hz to ≈30 Hz (Norris & Wood 1987; Wijnands & van der Klis 1998; Casella et al. 2004; Belloni et al. 2005). Based on the strength of the broadband variability and QPO characteristics, LFQPOs can be classified into three main types: type A, B and C (Casella et al. 2005).
Type-C QPOs are characterized by a strong and narrow peak in the power spectra (PS). The observed fractional root mean square (rms) amplitude ranges from 15% to 30%, and the QPO is simultaneously observed with strong broadband variability (Casella et al. 2004; Belloni et al. 2005). The origin of these QPOs remains an open question. Nevertheless, the leading suspects proposed in different models are instabilities in the accretion flow (Tagger & Pellat 1999; Titarchuk & Fiorito 2004; Mondal et al. 2009), geometrical effects caused by the Lense–Thirring precession (Stella & Vietri 1998; Stella et al. 1999; Ingram et al. 2009; Kubota et al. 2024), time-dependent Comptonization (García et al. 2021; Mastichiadis et al. 2022; Bellavita et al. 2022), and a precessing jet (Ma et al. 2021). Type-C QPOs were detected in the HIMS of J1727 with different X-ray telescopes, such as the Neil Gehrels Swift Observatory (Palmer & Parsotan 2023), the Neutron Star Interior Composition Explorer (NICER; Draghis et al. 2023; Bollemeijer et al. 2023; Rawat et al. 2025; Liao et al. 2025), Insight-Hard X-ray Modulation Telescope (Insight-HXMT; Yu et al. 2024; Chatterjee et al. 2024), and the Imaging X-ray Polarimetry Explorer (IXPE; Zhao et al. 2024; Ingram et al. 2024).
It is crucial to probe the QPO’s characteristics during a state transition to understand their origin and formation. Méndez et al. (2024) simultaneously fit the PS and the real and imaginary parts of the cross spectra (CS) using a multi-Lorentzian model in different LMXBs: GX 339−4, GRS 1915+105, and during the soft–to–hard transition of MAXI J1820+070. Their analyses showed that the real and imaginary parts of the CS must be fit because some QPOs can be significant in the CS, but not in the PS. In the soft-energy band (below 1 keV), König et al. (2024) and Fogantini et al. (2025) performed a similar analysis of the high-mass X-ray binary (HMXB) Cyg X-1 using NICER data. Despite the differences in the companion mass, several of these sources (including J1727) showed a sudden jump in the phase lags and a coherence drop at a specific frequency. This can be attributed to an additional narrow Lorentzian that is only visible in the imaginary part of the CS. This narrow Lorentzian is likely caused by the variability of the corona. Studies in the rising and decaying phases of the outburst revealed that these features only arise during the decaying phase of the soft–to–hard transition (Alabarta et al. 2022; Ma et al. 2023; Bellavita et al. 2025). This suggests that the inner radius of the disk expands, or that it might come from feedback processes from the corona. We present the first timing analysis of J1727 in the soft–to–hard transition with XMM–Newton data. We used the multi-Lorentzian decomposition of the PS and CS framework presented by Méndez et al. (2024). From the CS of two different energy bands, we derived the phase lags, which trace the phase angle in the complex Fourier plane of the cross vector for correlated signals (van der Klis et al. 1987; van der Klis 1989; Vaughan et al. 1997; Nowak et al. 1999a). We then calculated the coherence function, which quantifies the linear correlation between the two signals depending on the Fourier frequency (Vaughan & Nowak 1997).
This paper is structured as follows: We present the data set in Section 2 and the multi-Lorentzian model fitting of the PS and CS in Section 3. We discuss these results in Section 4, together with the phase lags and coherence fitting.
2. Data Sets
We observed J1727 with the XMM–Newton European Photon Imaging Camera (EPIC)-PN spectrograph (covering the 0.15−12 keV energy band; Jansen et al. 2001; Strüder et al. 2001) during the soft–to–hard transition (see Table A.1, PID 88500; Castro Segura 2020). The data were processed using the Science Analysis Software (SAS; Gabriel et al. 2004) pipeline from ESA. The calibrated photon event files for the PN camera were produced with epproc. We extracted, filtered for pile-up, and rebinned (0.1 s) the light curves using evselect for all three observations. We defined good time intervals (GTIs) to remove the telemetry gaps (see Fig. A.1), and we computed the power density and cross spectra, which we present in Section 3.
3. Analysis and results
Using the General High-Energy Aperiodic Timing Software (GHATS1), we calculated the PS in the 0.3−2 keV and 2−12 keV energy bands and the cross spectra between those same two bands. We fixed the sampling time to 0.006 s (200× the native instrumental resolution), which defines the Nyquist frequency at 0.5/0.006 = 83.3 Hz. Based on the typical length of the GTI segments allowed by the telemetry gaps, we set the interval length for computing the PS to 2048 × 0.006 s ≈ 12.3 s, which corresponds to a minimum frequency of ≈0.08 Hz. Consequently, the second observation (ObsID 0885000701) had 641 segments, and the third observation (ObsID 0885000801) had 1605 segments. To increase the signal-to-noise ratio at high frequencies, we logarithmically rebinned the PS and CS by a factor of 100.01 ≈ 1.023. The PS and CS were normalized to fractional rms units (van der Klis 1989). The Poisson noise and cross-talk levels were estimated empirically from the 30−80 Hz frequency range, where no signal was detected, and they were subtracted from the PS and the real part of the CS. Therefore, the PS and CS were only fit up to 30 Hz. Using the PS and CS, we computed the phase lags and the coherence for all observations, and we then fit them with the X-Ray Spectral Fitting Package (Xspec; Arnaud 1996).
3.1. The power spectra
No significant variability was observed in the PS of the first (soft state) observation, as expected. This analysis, therefore, focuses on the last two observations during the soft–to–hard transition. The PS were computed using GHATS and were fit in Xspec with an additive multi-Lorentzian model for each observation (see Fig. 1). Following Méndez et al. (2024), the Lorentzians were assumed to be coherent between the two energy bands across the Fourier frequencies, but incoherent between each other. Thus, the PS in two energy bands, x and y, can be defined as a sum of Lorentzians,
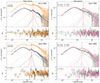 |
Fig. 1. Left panel: Power spectra of the second (top) and third (bottom) EPIC-PN observations of Swift J1727.8−1613 in the 0.3−2 keV (black) and 2−12 keV (orange) energy bands. Right panel: Real (green) and imaginary (pink) parts of the cross spectra of the same two observations using the 0.3−2 keV and 2−12 keV energy bands, rotated by 45° (see Sect. 3.2 for more details). The vertical red line shows the position of the central frequency ν0 of the imaginary QPO. The total model is shown with the continuous line, and the individual Lorentzians are shown as dotted lines. The residuals defined as Δχ = (data–model)/error are plotted below each fit. |
 (1)
(1)
with i = 1, 2, 3 for the three Lorentzians, Ai, Bi are the integrated power from zero to infinity of the Lorentzians in the band x and y, respectively, ν0; i is the central frequency for each individual Lorentzian, and Δi is their full width at half maximum (FWHM). Since for each Lorentzian function we assumed the coherence function to be γxy; i2(ν) = 1 and the modulus square of the CS to be |Gxy(ν)|2 = Ai Bi L2(ν; ν0; i, Δi), the former is defined as
 (2)
(2)
Table 1 gives the best-fitting parameters from the Xspec fitting with three Lorentzians for each observation. The central frequency ν0 and the FWHM of the Lorentzians in the 2−12 keV energy band are linked to the values from the low-energy band (0.3−2 keV). Only the fractional rms amplitude remains a free parameter in both bands. The quality factor Q is defined as the ratio of the central frequency of the QPO and the FWHM. The best-fits using the multi-Lorentzian model give χ2/d.o.f. ≈ 1.3 and χ2/d.o.f. ≈ 1.9 for the second and third observation, respectively. The model describes the data correctly in both cases, without prominent features in the residuals. The PS has a greater rms amplitude at higher energy overall, with a total rms of ≈17% in 0.3−2 keV versus ≈30% in 2−12 keV.
Best-fitting parameters of the PS and CS for the observations in the soft–to–hard transition.
Additionally, the rms of the first and last Lorentzians (referred to as L1 and L3) increase in the 0.3−2 keV energy band as the outburst evolved from the second to the third observation: the rms increases from ≈16.4% to ≈17.1% for L1 and from ≈4.5% to ≈6.4% for L3. In the 2−12 keV energy band, the rms similarly increases for L3, but decreases for L1 from ≈6.3% to ≈3.7%. On the other hand, the rms amplitude of L2 decreases in both energy bands from ≈3.5% to ≈2.9% in the 0.3−2 keV energy band and from ≈6.3% to ≈3.7% in the 2−12 keV energy band.
Furthermore, the central frequencies of the three Lorentzians shift toward lower frequencies as the source hardens. They decrease by ≈16%, ≈23%, and ≈28% for L1, L2, and L3, respectively, between the second and third observation. The Lorentzians also become narrower, with a decrease in the FWHMs of ≈18%, ≈62% and ≈20% between the second and third observation (see Table 1). As a result, when the source hardens, the quality factor of the second Lorentzian increases from 2.07 to 4.12, but decreases for L3 from 0.60 to 0.54. The Q factor of L1 simultaneously remains constant around 0.23 within the errors.
3.2. The real and imaginary parts of the cross spectrum
Following Méndez et al. (2024), the real and imaginary parts of the CS were fit in a similar way as the PS. They were decomposed into a linear combination of Lorentzians multiplied by the phase-lag dependence using the relation
![Mathematical equation: $$ \begin{aligned} \mathfrak{R} [G_{xy} (\nu )]&= \sum _{i = 1}^3 C_i \ L(\nu ; \nu _{0;i}, \Delta _i) \ \cos {(\Delta \phi _{xy;i} (\nu ) + \pi /4)}\nonumber \\ \mathfrak{I} [G_{xy} (\nu )]&= \sum _{i = 1}^3 C_i \ L(\nu ; \nu _{0;i}, \Delta _i) \ \sin {(\Delta \phi _{xy;i} (\nu ) + \pi /4)}, \end{aligned} $$](/articles/aa/full_html/2025/11/aa55486-25/aa55486-25-eq5.gif) (3)
(3)
with  , and the frequency-dependent phase lags between the two signals were defined as
![Mathematical equation: $$ \begin{aligned} \Delta \phi _{xy;i} (\nu ) = \tan ^{-1} \left({\frac{\mathfrak{I} [G_{xy;i} (\nu )]}{\mathfrak{R} [G_{xy;i} (\nu )]}}\right) = g_i(\nu ;p_{j,i}). \end{aligned} $$](/articles/aa/full_html/2025/11/aa55486-25/aa55486-25-eq7.gif) (4)
(4)
We explicitly treated the phase lags of the ith Lorentzian as a function of the parameters pj, i. From now on, we assume the phase lags of each Lorentzian to be constant with frequency, that is, gi(ν; pj, i) = Δϕi, where Δϕi is a parameter of the model. This is the constant phase-lag model as defined by Méndez et al. (2024). The phase lags of J1727 are close to zero across the Fourier frequencies, and the amplitude of the imaginary part of the CS is therefore smaller than that of the real part. Consequently, the cross vectors can be rotated by 45° to have comparable real and imaginary parts. This generates more stable fits in Xspec and does not affect the best-fitting parameters (see Méndez et al. 2024). By multiplying the cross vector (decomposed into a real and imaginary part) by the rotation matrix, we therefore calculated the real and imaginary parts of the CS as ℜ[cos(π/4)]−ℑ[sin(π/4)] and ℜ[sin(π/4)]+ℑ[cos(π/4)], respectively. The central frequencies and FWHMs of the three Lorentzians in the CS are tied to those in the 0.3−2 keV band of the PS. The normalization of the real part of the CS is given by the parameter C, as previously defined. Table 1 shows the best-fitting parameters of the phase lags of the CS between 0.3−2 keV and 2−12 keV. The rotated real (green) and rotated imaginary (pink) parts of the CS we fit are shown in the right panel of Fig. 1. Below 1.5 Hz, the rotated real and imaginary parts of the CS overlap in the two energy bands for both observations. Above 1.5 Hz, the rotated imaginary part of the CS in the 2−12 keV energy range is larger than the rotated real part. A bump is observed in the rotated imaginary part of the CS at ≈3 Hz, and it is well fit by a narrow Lorentzian. In both observations, we identify a narrow Lorentzian in the PS and the CS with a larger imaginary component than in the real part. We call this QPO the imaginary QPO, as first expressed by Méndez et al. (2024). While the rms of the imaginary QPO stays more or less constant when the system hardens, the real part of the QPO increases.
3.3. The phase lags and coherence
The last column of Table 1 shows the best-fitting parameters for the phase lags. The phase lags of the three Lorentzians increase by ≈37%, ≈13%, and ≈19% (for L1, L2, and L3, respectively) between the second and third observation. From the PS and CS fits, we derived a model of the phase lags and the coherence, calculated in the same energy bands as the power and cross spectra. Fig. 2 displays the phase lags (top panel) and the coherence (bottom panel) for the two observations, together with the predicted model. Below 1 Hz, the phase lags are constant around ≈0 rad on average, with a slight excess at ≈0.2 Hz and ≈0.5 Hz that is significant at the 68% confidence level. Then, the phase lags reach a maximum value at the imaginary QPO frequency, marked by the vertical dotted red line, and stabilize to a higher constant value at ≈1.8 rad after this for both observations. In the second observation, however, the phase lags are narrower and are dominated by the uncertainties above 7 Hz for both observations.
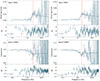 |
Fig. 2. Phase lags in radian (top) and the coherence function (bottom) for the second (left) and third (right) EPIC-PN observation of Swift J1727.8−1613. The continuous lines show the predicted model from the fits of the PS and CS represented in Fig. 1. The bottom panels show the residuals defined as (data-model)/error. The dotted vertical red line indicates the central frequency of the imaginary QPO for each observation. |
While the phase lags increase at the central frequency of the imaginary QPO, the coherence drops. Below 1 Hz, the average coherence value is ≈1, it then drops to ≈0.8 at the frequency of the imaginary QPO and remains constant at ≈0.9 after the dip. Similarly to the phase lags, the residuals drop significantly at ≈0.5 Hz, aligning with a slight decrease in the coherence. These features suggest that an additional component contributes to the variability at low frequency. We did not add another Lorentzian to account for this component in our model, because we aimed to fit the prominent variable components with as few Lorentzians as possible.
3.4. The energy dependence of the QPO lags and rms amplitude
To analyze the QPO lags and rms amplitude energy dependence, we computed the fast Fourier transforms (FFTs) and CS for each narrow energy band relative to the full (0.3−12 keV) energy band at the imaginary QPO frequency. The data were then fit using the multi-Lorentzian model we defined above, and the central frequencies and FWHMs were fixed to the best-fit values listed in Table 1. Fig. 3 shows the energy dependence of the fractional rms and the phase lags. In epoch XMM2, the rms amplitude of the QPO increased from 2% to 9.5% between 0.5 keV and 8 keV. In epoch XMM3, the rms amplitude increased from 2% to ≈7% between 0.5 keV and 5.5 keV. The higher-energy bands are poorly constrained and the errors are significant up to 3σ. We therefore did not consider them in the analysis.
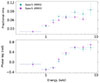 |
Fig. 3. Energy dependence of the fractional rms (top) and the phase lags (bottom) of the imaginary QPO for the second (blue circles) and third (purple squares) EPIC-PN observations of Swift J1727.8−1613. |
On the other hand, the phase lags reached a minimum value at 1 keV. In epoch XMM2, the phase lags decreased from ≈−0.08 rad to ≈−0.28 rad between 0.5 keV and 1 keV and increased again from ≈−0.21 rad at 1.2 keV to ≈0.58 rad at 8 keV. In epoch XMM3, a similar behavior is observed with a decrease from ≈−0.09 rad at 0.5 keV to a minimum value of ≈−0.31 rad at 1 keV that increased above 1 keV.
4. Discussion and conclusions
In Section 3, we showed that the XMM EPIC-PN data of the BH LMXB Swift J1727.8−1613 reveal a type-C QPO in the soft–to–hard transition. While the characteristic Lorentzians frequencies shift to lower values as the source hardened, the phase lags increased and the coherence function dropped at the QPO frequency. This supports again the possible cause–to–effect relation between the type-C QPO and the features observed in the lags and the coherence. An in-depth discussion is provided below.
4.1. The type-C QPO
We identified a narrow Lorentzian in the PS characterized by a higher rms amplitude in the imaginary part than in the real part of the CS, where the rms of the real counterpart increased between the second and the third observation. The origin of the imaginary QPO is still unclear: In Cyg X-1, König et al. (2024) suggested a beat between the two broad Lorentzians, that might create a third component causing the QPO, as is often observed in the PS, whereas Méndez et al. (2024) argued that it comes from an independent phenomenon. Nonetheless, the imaginary QPO of the source seems to correspond to the QPO observed in the PS.
The QPO identified in J1727’s PS and CS has a central frequency at ≈2.6 Hz in the second observation that shifts to ≈2 Hz in the third observation. Furthermore, the total rms is ≈17% and ≈18% in the 0.3−2 keV energy band for the second and last observation, respectively, and it reaches ≈30% in the 2−12 keV energy band for both observations. Based on the brightness of J1727 and on high-rms LFQPO in the PS and CS, we classified the LFQPO that is observed in the soft–to–hard transition as a type-C QPO (Motta et al. 2011). In the rms–intensity diagram for black hole transients defined by Muñoz-Darias et al. (2011), the source would be close to the hard line, which is defined as a linear relation between the absolute rms and the count rate observed in the canonical low-hard state. Weak type-C QPOs are generally observed at the hard line in the hard state and migrate above the line as the rms increases and reaches 30%, and they progressively leave the hard line. The Q factor values for J1727 are lower than those usually observed for type-C QPOs (≈7−10), however. Low Q factors in type-C QPOs were also observed in MAXI J1348−630 (Alabarta et al. 2022) and MAXI J1820+070 (Ma et al. 2023), where they ranged between 0.2 and 7.
On the other hand, as the system hardened, the QPO moved to lower frequencies. This frequency shift (probably induced by the Comptonizing plasma that dominates the emission in the hard state) has previously been observed in other XBs (MAXI J1820+070; König et al. 2024; Fogantini et al. 2025 and Cyg X-1; Méndez et al. 2024; Bellavita et al. 2025). Furthermore, during the soft–to–hard transition of MAXI J1348−630, Alabarta et al. (2025) interpreted the shift in the QPO frequency to lower frequencies as indicative of coronal expansion. In the case of GRS 1915+105, Méndez et al. (2022) and García et al. (2022) explained the frequency shift by a perpendicular contraction of the corona with respect to the accretion disk. Thus, the frequency shift suggests a geometric change in the corona.
Additionally, observed in the soft–to–hard transition, the type-C QPO can be attributed to the expansion of the truncated inner radius of the disk or to feedback processes from the corona (Bellavita et al. 2022). The Lense-Thirring precession, in which the inner accretion flow precesses with respect to the thermal disk (see Ingram et al. 2009), has also been proposed as the origin of type-C QPOs in XBs. This was supported by studies that reported a tight anticorrelation between the outer radius of the Comptonizing region and νQPO (Kubota et al. 2024). The analysis of GRS 1915+105 by Nathan et al. (2022) revealed an inner disk radius that was too small and a reprocessing time that was too long to support this model, however.
In addition to the type-C QPO, the broadband Lorentzians L1 and L3 similarly shift to lower frequencies as the source hardens. In the 0.3−2 keV energy band, however, their rms amplitude increases as the source transitions, unlike that of the type-C QPO. This behavior was previously observed in GX 339−4 (Muñoz-Darias et al. 2011). In the 2−12 keV hard band, the rms increases for L3 for a harder emission, but it decreases for L1. Thus, as suggested by Bellavita et al. (2025), the two broad Lorentzians seem to be independent from each other and might come from variability processes that differ from the QPO. König et al. (2024) supported this assumption by proposing that L1 comes from the accretion disk and is modulated by the Comptonization and that L3 is associated with the Comptonized medium. On the other hand, Wilkinson & Uttley (2009) linked the L1 variability to an unstable accretion flow in the disk (although they reached this conclusion by fitting the covariance spectrum with the same model as the time-averaged spectrum, which only holds when the overall normalization of the model alone varies).
4.2. Phase-lag jump
At the QPO frequency, the phase lags reach a maximum, also called the cliff. This was previously observed in other XBs (Méndez et al. 2024; Bellavita et al. 2025). Before and after the QPO frequency, however, the phase lags remain constant at ≈0 rad and ≈0.18 rad, respectively, for both observations, with a sharper cliff in the third observation. In the frequency range in which one Lorentzian dominates the PS, the phase lags remained constant on average, where each Lorentzian had its own lags, potentially caused by separate resonances (Méndez et al. 2024). At the intersection of the two Lorentzians, in contrats, the phase lags transition from one constant value to the next. Nowak et al. (1999b) attributed this difference to the total phase lags at each Fourier frequency being equal to the average phase lags of the individual Lorentzians, weighted by the product of their amplitudes in the two energy bands at which they were calculated (defined as the small-angle approximation of Eq. 9 in Méndez et al. 2024). As a result, the phase lags are constant over a given frequency range when the Fourier amplitudes of one Lorentzian dominate. Moreover, no cliff is observed in the hard-energy bands. Similarly observed in the rising phase of the outburst of J1727, Yu et al. (2024) did not find a phase-lag jump in the 1−10 keV and 25−150 keV energy bands, but still detected it in the soft energy bands, 1−2 keV and 2−10 keV. This might suggest that soft energies are essential to observe the phase-lag jump, regardless of the transition direction. This similarly indicates that the QPO originated from variations in a soft component that is linked to the accretion disk. Furthermore, as the source hardens, the Comptonization-driven variability from the corona intensifies and might introduce additional variability in the accretion disk.
4.3. Coherence drop
While the phase lags reached a maximum value at the QPO frequency, the coherence reached a local minimum (König et al. 2024; Méndez et al. 2024; Bellavita et al. 2025; Fogantini et al. 2025), with different plateau values before and after the QPO frequency. Before the drop, the constant coherence of ≈1 indicates the physical interconnection between the variability in the disk and the corona (König et al. 2024). After the drop, the constant value of ≈0.9 indicates an increasing variability of the corona at the QPO frequency. In order to test this assumption, we fit the PS, CS, phase lags, and coherence with only two Lorentzians instead of three. We obtained worse fits, with a χ2/d.o.f. ≈ 1.5 for the second observation, and a χ2/d.o.f. ≈ 2.4 for the third observation. In the residuals of the PS and CS, we identified a broad Gaussian-shaped component that was significant between 3σ and 4σ for the phase lags and coherence fits. This indicates that the model misses a component. Consequently, three Lorentzians (i.e., including a narrow one), are required at least for the model to correctly fit the PS, CS, phase-lag cliff, and coherence drop of J1727, similarly to MAXI J1820+070 (Bellavita et al. 2025; Fogantini et al. 2025) and Cyg X-1 (König et al. 2024). Ultimately, the drop in coherence might come from a weaker interaction between the large corona and the accretion disk at the QPO frequency as the transition evolves (Alabarta et al. 2025), which would explain the sharper coherence drop and phase-lag cliff observed in the last observation (see Fig. 2).
The phase-lag jump and the coherence drop seem to be generated overall by low-energy variations from a soft component in the accretion disk at the type-C QPO frequency, induced by variations in the corona geometry (Méndez et al. 2022; Alabarta et al. 2025). Only observed in the decaying phase of the outburst (Méndez et al. 2024; Alabarta et al. 2025; König et al. 2024; Bellavita et al. 2025; Fogantini et al. 2025), these features are significant at low X-ray flux in the soft–to–hard transition. Moreover, the phase lags and coherence of J1727 show a significant excess at ≈0.4 Hz and ≈3 Hz that was previously observed in other sources with a different instrument (Méndez et al. 2024; König et al. 2024; Rout et al. 2025). This confirms the physical origin of the signal.
4.4. QPO energy dependence
In J1727, the QPO frequency does not depend on energy. It stays constant in the 0.3−2 keV, compared to the 2−12 keV energy bands. At the QPO frequency (≈2 Hz), the fractional rms continually increases with energy as a result of the decreasing contribution of the disk at higher energies (as observed in other sources; Alabarta et al. 2022, 2025; Fogantini et al. 2025; Bellavita et al. 2025). Bellavita et al. (2022) showed that the fractional rms as a function of energy is strongly dependent on the power-law index (Γ), based on the variable Comptonization model for low-frequency QPOs, vKompth. Similarly, the rms of J1727 decreases as the source hardens (i.e., Γ decreases), this suggests that the drop in the QPO rms amplitude may be driven by the decrease in Γ. The phase lags simultaneously reach a minimum value around 1 keV for J1727, around 1.6 keV for MAXI J1348−630 (Alabarta et al. 2025), and around 1.5 keV for MAXI J1820+070 (Ma et al. 2023), and they remain constant ⪆4 keV. The U-shaped energy lags might be explained by a fraction of the cold seed photons from the accretion disk that enters the extended corona in the horizontal direction and results in a significant drop in the phase lags (Liao et al. 2025; Alabarta et al. 2025; Bellavita et al. 2025). Furthermore, as the source hardens, Bellavita et al. (2025) reported a stronger drop in the phase lags.
5. Summary
-
This analysis revealed a type-C QPO in the soft–to–hard transition of the LMXB Swift J1727.8–1613. This represents the first ever detection of a type-C QPO in the soft–to–hard transition of a BH XB using XMM–Newton data (it was previously only observed with other telescopes, e.g., NICER or RXTE).
-
The QPO is significantly detected in the imaginary part of the CS and the PS, with a central frequency at ≈2.6 Hz, shifting to ≈2 Hz as the source spectrum hardens. This indicates geometrical changes in the corona. The broadband fractional rms amplitude in the 0.3−2 keV energy band increases simultaneously and the rms covariance of the QPO decreases, which suggests fluctuations in the accretion disk (probably from the mass-accretion rate) and modulated by the Comptonization. Considering the total rms of about 17% and 30% between the last two observations and the brightness of the source, we classified the QPO as a type-C QPO.
-
The unique detection of the coherence drop and the phase-lag excess at the QPO frequency in J1727 suggests a weaker interaction between the large corona and the accretion disk at the QPO frequency as the transition evolves from the soft to the hard state. The first detection of the coherence drop in the soft–to–hard transition with a telescope other than NICER implies that it has a physical origin and is not an instrumental artefact.
Follow-up modeling of this source may help us to understand the relative strength of the type-C QPO in the imaginary component of the CS.
Data Availability
The data underlying this article is publicly available in: Pan-STARRS https://archive.stsci.edu/panstarrs/ and AAVSO https://www.aavso.org. Remaining data will be shared on reasonable request to the corresponding author.
Acknowledgments
Research is based on observations obtained with XMM-Newton, an ESA science mission with instruments and contributions directly funded by ESA Member States and NASA. M.B. acknowledges the support from GAUK project No. 102323. J.S. thanks GACR project 21-06825X for the support. NCS acknowledges support from the Science and Technology Facilities Council (STFC) grant ST/X001121/1. FG acknowledges support from PIBAA 1275 and PIP 0113 (CONICET). FG was also supported by grant PID2022-136828NBC42 funded by the Spanish MCIN/AEI/10.13039/501100011033 and ERDF A way of making Europe. MM acknowledges the research programme Athena with project number 184.034.002, which is (partly) financed by the Dutch Research Council (NWO). FMV acknowledges support from the European Union’s Horizon Europe research and innovation programme with the Marie Skłodowska-Curie grant agreement No. 101149685. We thank Santiago del Palacio for valuable discussion and comments.
References
- Alabarta, K., Méndez, M., García, F., et al. 2022, MNRAS, 514, 2839 [NASA ADS] [CrossRef] [Google Scholar]
- Alabarta, K., Méndez, M., García, F., et al. 2025, ApJ, 980, 251 [NASA ADS] [CrossRef] [Google Scholar]
- Arnaud, K. A. 1996, ASP Conf. Ser., 101, 17 [Google Scholar]
- Bellavita, C., García, F., Méndez, M., & Karpouzas, K. 2022, MNRAS, 515, 2099 [NASA ADS] [CrossRef] [Google Scholar]
- Bellavita, C., Méndez, M., García, F., Ma, R., & König, O. 2025, A&A, 696, A128 [NASA ADS] [CrossRef] [EDP Sciences] [Google Scholar]
- Belloni, T., Psaltis, D., & van der Klis, M. 2002, ApJ, 572, 392 [NASA ADS] [CrossRef] [Google Scholar]
- Belloni, T., Homan, J., Casella, P., et al. 2005, A&A, 440, 207 [NASA ADS] [CrossRef] [EDP Sciences] [Google Scholar]
- Bollemeijer, N., Uttley, P., Buisson, D., et al. 2023, ATel, 16247, 1 [NASA ADS] [Google Scholar]
- Burridge, B. J., Miller-Jones, J. C. A., Bahramian, A., et al. 2025, ArXiv e-prints [arXiv:2502.06448] [Google Scholar]
- Casella, P., Belloni, T., Homan, J., & Stella, L. 2004, A&A, 426, 587 [NASA ADS] [CrossRef] [EDP Sciences] [Google Scholar]
- Casella, P., Belloni, T., & Stella, L. 2005, ApJ, 629, 403 [Google Scholar]
- Castro Segura, N. 2020, Outflow Legacy Accretion Survey: Unveiling the Wind Driving Mechanism in BHXRBs, XMM-Newton Proposal ID #88500 [Google Scholar]
- Castro-Tirado, A. J., Sanchez-Ramirez, R., Caballero-Garcia, M. D., et al. 2023, ATel, 16208, 1 [NASA ADS] [Google Scholar]
- Chatterjee, K., Mondal, S., Singh, C. B., & Sugizaki, M. 2024, ApJ, 977, 148 [Google Scholar]
- Dichiara, S., Kennea, J. A., Page, K. L., et al. 2023, GRB Coordinates Network, 34542, 1 [Google Scholar]
- Done, C., Gierliński, M., & Kubota, A. 2007, A&ARv, 15, 1 [Google Scholar]
- Draghis, P. A., Miller, J. M., Homan, J., et al. 2023, ATel, 16219, 1 [NASA ADS] [Google Scholar]
- Dunn, R. J. H., Fender, R. P., Körding, E. G., Belloni, T., & Cabanac, C. 2010, MNRAS, 403, 61 [Google Scholar]
- Fender, R. P., Belloni, T. M., & Gallo, E. 2004, MNRAS, 355, 1105 [NASA ADS] [CrossRef] [Google Scholar]
- Fogantini, F. A., García, F., Méndez, M., König, O., & Wilms, J. 2025, A&A, 696, A237 [NASA ADS] [CrossRef] [EDP Sciences] [Google Scholar]
- Frank, J., King, A., & Raine, D. J. 2002, Accretion Power in Astrophysics: Third Edition (Cambridge: Cambridge University Press) [Google Scholar]
- Gabriel, C., Denby, M., Fyfe, D. J., et al. 2004, ASP Conf. Ser., 314, 759 [Google Scholar]
- García, F., Mendez, M., & Karpouzas, K. 2021, 43rd COSPAR Scientific Assembly. Held 28 January – 4 February, 43, 1695 [Google Scholar]
- García, F., Karpouzas, K., Méndez, M., et al. 2022, MNRAS, 513, 4196 [Google Scholar]
- Giannios, D., & Spruit, H. C. 2004, A&A, 427, 251 [NASA ADS] [CrossRef] [EDP Sciences] [Google Scholar]
- Hirsch, M., Pottschmidt, K., Smith, D. M., et al. 2020, A&A, 636, A51 [NASA ADS] [CrossRef] [EDP Sciences] [Google Scholar]
- Homan, J., Wijnands, R., van der Klis, M., et al. 2001, ApJS, 132, 377 [NASA ADS] [CrossRef] [Google Scholar]
- Ingram, A., Done, C., & Fragile, P. C. 2009, MNRAS, 397, L101 [Google Scholar]
- Ingram, A., Bollemeijer, N., Veledina, A., et al. 2024, ApJ, 968, 76 [NASA ADS] [CrossRef] [Google Scholar]
- Jansen, F., Lumb, D., Altieri, B., et al. 2001, A&A, 365, L1 [NASA ADS] [CrossRef] [EDP Sciences] [Google Scholar]
- König, O., Mastroserio, G., Dauser, T., et al. 2024, A&A, 687, A284 [NASA ADS] [CrossRef] [EDP Sciences] [Google Scholar]
- Kubota, A., Done, C., Tsurumi, K., & Mizukawa, R. 2024, MNRAS, 528, 1668 [Google Scholar]
- Liao, J., Chang, N., Cui, L., et al. 2025, ApJ, 986, 3 [Google Scholar]
- Ma, X., Tao, L., Zhang, S.-N., et al. 2021, Nat. Astron., 5, 94 [NASA ADS] [CrossRef] [Google Scholar]
- Ma, R., Méndez, M., García, F., et al. 2023, MNRAS, 525, 854 [CrossRef] [Google Scholar]
- Mastichiadis, A., Petropoulou, M., & Kylafis, N. D. 2022, A&A, 662, A118 [NASA ADS] [CrossRef] [EDP Sciences] [Google Scholar]
- Mata Sánchez, D., Muñoz-Darias, T., Armas Padilla, M., Casares, J., & Torres, M. A. P. 2024, A&A, 682, L1 [NASA ADS] [CrossRef] [EDP Sciences] [Google Scholar]
- Matsuoka, M., Kawasaki, K., Ueno, S., et al. 2009, PASJ, 61, 999 [Google Scholar]
- Méndez, M., Karpouzas, K., García, F., et al. 2022, Nat. Astron., 6, 577 [CrossRef] [Google Scholar]
- Méndez, M., Peirano, V., García, F., et al. 2024, MNRAS, 527, 9405 [Google Scholar]
- Mihara, T., Kawai, N., Yoshida, A., et al. 2002, SPIE Conf. Ser., 4497, 173 [Google Scholar]
- Mihara, T., Nakajima, M., Sugizaki, M., et al. 2011, PASJ, 63, S623 [Google Scholar]
- Mondal, S., Basu, P., & Chakrabarti, S. K. 2009, MNRAS, 396, 1038 [Google Scholar]
- Motta, S., Muñoz-Darias, T., Casella, P., Belloni, T., & Homan, J. 2011, MNRAS, 418, 2292 [NASA ADS] [CrossRef] [Google Scholar]
- Muñoz-Darias, T., Motta, S., & Belloni, T. M. 2011, MNRAS, 410, 679 [Google Scholar]
- Nathan, E., Ingram, A., Homan, J., et al. 2022, MNRAS, 511, 255 [NASA ADS] [CrossRef] [Google Scholar]
- Negoro, H., Serino, M., Nakajima, M., et al. 2023, ATel, 16205, 1 [NASA ADS] [Google Scholar]
- Norris, J. P., & Wood, K. S. 1987, ApJ, 312, 732 [Google Scholar]
- Nowak, M. A., Vaughan, B. A., Wilms, J., Dove, J. B., & Begelman, M. C. 1999a, ApJ, 510, 874 [NASA ADS] [CrossRef] [Google Scholar]
- Nowak, M. A., Wilms, J., & Dove, J. B. 1999b, ApJ, 517, 355 [NASA ADS] [CrossRef] [Google Scholar]
- Palmer, D. M., & Parsotan, T. M. 2023, ATel, 16215, 1 [NASA ADS] [Google Scholar]
- Podgorný, J., Svoboda, J., Dovčiak, M., et al. 2024, A&A, 686, L12 [NASA ADS] [CrossRef] [EDP Sciences] [Google Scholar]
- Psaltis, D., Belloni, T., & van der Klis, M. 1999, ApJ, 520, 262 [NASA ADS] [CrossRef] [Google Scholar]
- Rawat, D., Méndez, M., García, F., & Maggi, P. 2025, A&A, 697, A229 [NASA ADS] [CrossRef] [EDP Sciences] [Google Scholar]
- Remillard, R. A., & McClintock, J. E. 2006, ARA&A, 44, 49 [Google Scholar]
- Rout, S. K., García, F., Méndez, M., et al. 2025, ApJ, 990, 43 [Google Scholar]
- Shakura, N. I., & Sunyaev, R. A. 1973, A&A, 24, 337 [NASA ADS] [Google Scholar]
- Stella, L., & Vietri, M. 1998, ApJ, 492, L59 [NASA ADS] [CrossRef] [Google Scholar]
- Stella, L., Vietri, M., & Morsink, S. M. 1999, ApJ, 524, L63 [CrossRef] [Google Scholar]
- Strüder, L., Briel, U., Dennerl, K., et al. 2001, A&A, 365, L18 [Google Scholar]
- Sugizaki, M., Mihara, T., Serino, M., et al. 2011, PASJ, 63, S635 [Google Scholar]
- Svoboda, J., Dovčiak, M., Steiner, J. F., et al. 2024, ApJ, 966, L35 [NASA ADS] [CrossRef] [Google Scholar]
- Tagger, M., & Pellat, R. 1999, A&A, 349, 1003 [NASA ADS] [Google Scholar]
- Titarchuk, L., & Fiorito, R. 2004, ApJ, 612, 988 [NASA ADS] [CrossRef] [Google Scholar]
- van der Klis, M. 1989, ARA&A, 27, 517 [NASA ADS] [CrossRef] [Google Scholar]
- van der Klis, M., Hasinger, G., Stella, L., et al. 1987, ApJ, 319, L13 [NASA ADS] [CrossRef] [Google Scholar]
- Vaughan, B. A., & Nowak, M. A. 1997, ApJ, 474, L43 [CrossRef] [Google Scholar]
- Vaughan, B. A., van der Klis, M., Méndez, M., et al. 1997, ApJ, 483, L115 [NASA ADS] [CrossRef] [Google Scholar]
- Veledina, A., Muleri, F., Dovčiak, M., et al. 2023, ApJ, 958, L16 [NASA ADS] [CrossRef] [Google Scholar]
- Vernet, J., Dekker, H., D’Odorico, S., et al. 2011, A&A, 536, A105 [NASA ADS] [CrossRef] [EDP Sciences] [Google Scholar]
- Weisskopf, M. C., Soffitta, P., Baldini, L., et al. 2022, J. Astron. Telesc. Instrum. Syst., 8, 026002 [NASA ADS] [CrossRef] [Google Scholar]
- Wijnands, R., & van der Klis, M. 1998, ATel, 17, 1 [NASA ADS] [Google Scholar]
- Wilkinson, T., & Uttley, P. 2009, MNRAS, 397, 666 [NASA ADS] [CrossRef] [Google Scholar]
- Yu, W., Bu, Q.-C., Zhang, S.-N., et al. 2024, MNRAS, 529, 4624 [NASA ADS] [CrossRef] [Google Scholar]
- Zdziarski, A. A., Gierliński, M., Mikołajewska, J., et al. 2004, MNRAS, 351, 791 [NASA ADS] [CrossRef] [Google Scholar]
- Zhao, Q.-C., Tao, L., Li, H.-C., et al. 2024, ApJ, 961, L42 [NASA ADS] [CrossRef] [Google Scholar]
Appendix A: Observation log and light curve
This dataset is part of a multiwavelength observational campaign with epochs defined by the optical observations from the Very Large Telescope (VLT), performed with the X-shooter spectrograph (Vernet et al. 2011); see Castro Segura et al. in preparation.
 |
Fig. A.1. Zoomed XMM EPIC-PN light curves of Swift J1727.8–1613 in the 0.2−12 keV energy range, with a bin size of 0.1 s for the second observation (epoch XMM2). The shaded regions delimit the telemetry gaps and the colored data points are the good time intervals (GTIs). |
XMM–Newton EPIC-PN observation log of Swift J1727.8–1613.
Appendix B: Hardness intensity diagram
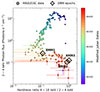 |
Fig. B.1. Hardness intensity diagram (HID) of Swift J1727.8–1613 from the 2023 outburst. The photon fluxes are derived from the MAXI/GSC instrument with a bin size of 1 day from the "on-demand process" archives. The hardness ratio is defined as the photon flux ratio in the 4−10 keV over the photon flux in the 2−4 keV energy band. |
Figure B.1 shows the hardness intensity diagram (HID) of Swift J1727.8–1613 since the start of the 2023 outburst. The light curves were obtained from the Monitor of All-sky X-ray Image’s (MAXI; Matsuoka et al. 2009) Gas Slit Camera (GSC; 2−30 keV; Mihara et al. 2002; Sugizaki et al. 2011; Mihara et al. 2011), in the 2−10 keV energy band, and the MAXI "on-demand process" archives2. The position of the source in the HID during the XMM EPIC-PN observations are shown in black diamonds. The hardness ratio (HR) is defined as the ratio of the photon flux in the 4−10 keV energy band to that in the 2−4 keV energy band.
All Tables
Best-fitting parameters of the PS and CS for the observations in the soft–to–hard transition.
All Figures
|
Fig. 1. Left panel: Power spectra of the second (top) and third (bottom) EPIC-PN observations of Swift J1727.8−1613 in the 0.3−2 keV (black) and 2−12 keV (orange) energy bands. Right panel: Real (green) and imaginary (pink) parts of the cross spectra of the same two observations using the 0.3−2 keV and 2−12 keV energy bands, rotated by 45° (see Sect. 3.2 for more details). The vertical red line shows the position of the central frequency ν0 of the imaginary QPO. The total model is shown with the continuous line, and the individual Lorentzians are shown as dotted lines. The residuals defined as Δχ = (data–model)/error are plotted below each fit. |
| In the text | |
|
Fig. 2. Phase lags in radian (top) and the coherence function (bottom) for the second (left) and third (right) EPIC-PN observation of Swift J1727.8−1613. The continuous lines show the predicted model from the fits of the PS and CS represented in Fig. 1. The bottom panels show the residuals defined as (data-model)/error. The dotted vertical red line indicates the central frequency of the imaginary QPO for each observation. |
| In the text | |
|
Fig. 3. Energy dependence of the fractional rms (top) and the phase lags (bottom) of the imaginary QPO for the second (blue circles) and third (purple squares) EPIC-PN observations of Swift J1727.8−1613. |
| In the text | |
|
Fig. A.1. Zoomed XMM EPIC-PN light curves of Swift J1727.8–1613 in the 0.2−12 keV energy range, with a bin size of 0.1 s for the second observation (epoch XMM2). The shaded regions delimit the telemetry gaps and the colored data points are the good time intervals (GTIs). |
| In the text | |
|
Fig. B.1. Hardness intensity diagram (HID) of Swift J1727.8–1613 from the 2023 outburst. The photon fluxes are derived from the MAXI/GSC instrument with a bin size of 1 day from the "on-demand process" archives. The hardness ratio is defined as the photon flux ratio in the 4−10 keV over the photon flux in the 2−4 keV energy band. |
| In the text | |
Current usage metrics show cumulative count of Article Views (full-text article views including HTML views, PDF and ePub downloads, according to the available data) and Abstracts Views on Vision4Press platform.
Data correspond to usage on the plateform after 2015. The current usage metrics is available 48-96 hours after online publication and is updated daily on week days.
Initial download of the metrics may take a while.