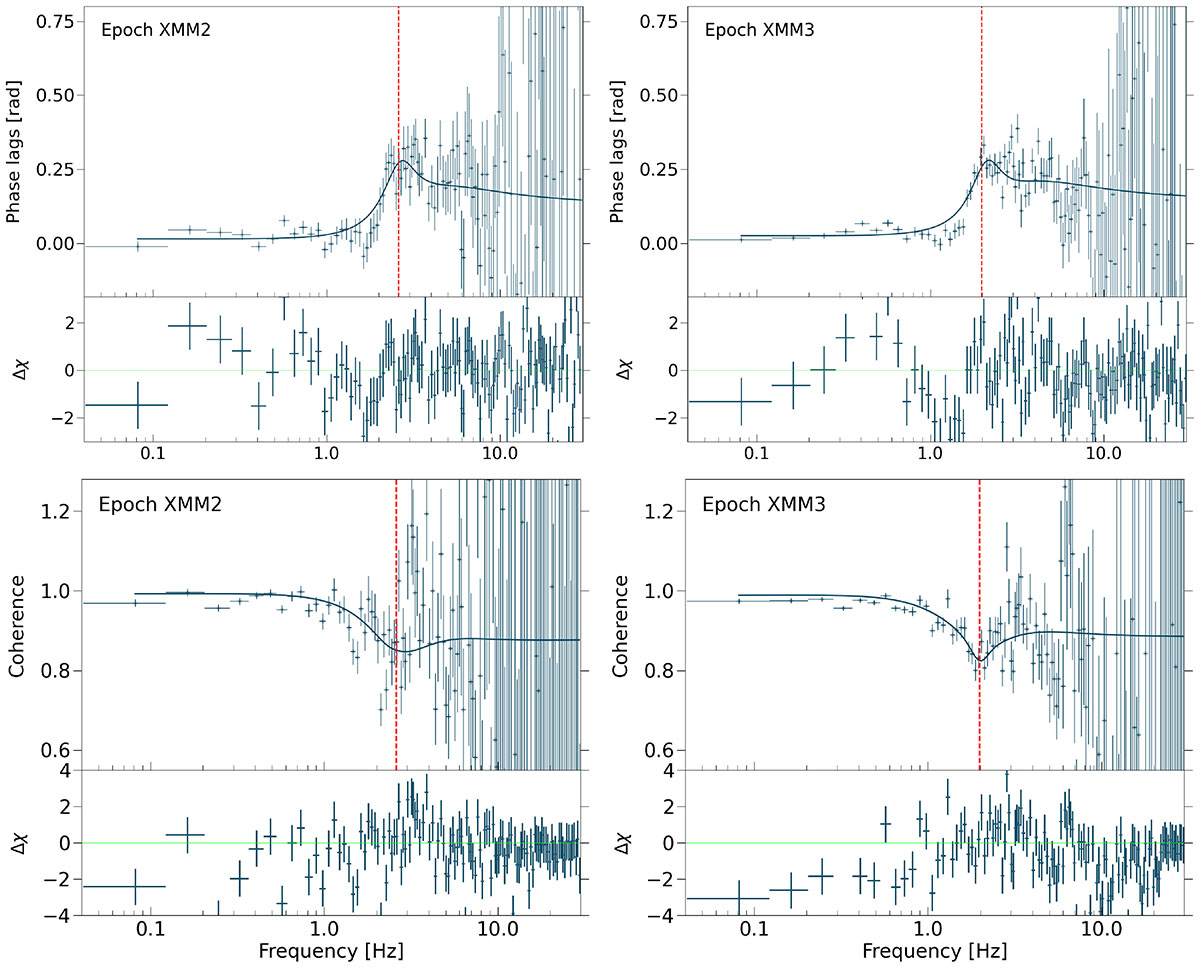
Fig. 2.
Download original image
Phase lags in radian (top) and the coherence function (bottom) for the second (left) and third (right) EPIC-PN observation of Swift J1727.8−1613. The continuous lines show the predicted model from the fits of the PS and CS represented in Fig. 1. The bottom panels show the residuals defined as (data-model)/error. The dotted vertical red line indicates the central frequency of the imaginary QPO for each observation.
Current usage metrics show cumulative count of Article Views (full-text article views including HTML views, PDF and ePub downloads, according to the available data) and Abstracts Views on Vision4Press platform.
Data correspond to usage on the plateform after 2015. The current usage metrics is available 48-96 hours after online publication and is updated daily on week days.
Initial download of the metrics may take a while.