Open Access
Fig. 11.
Download original image
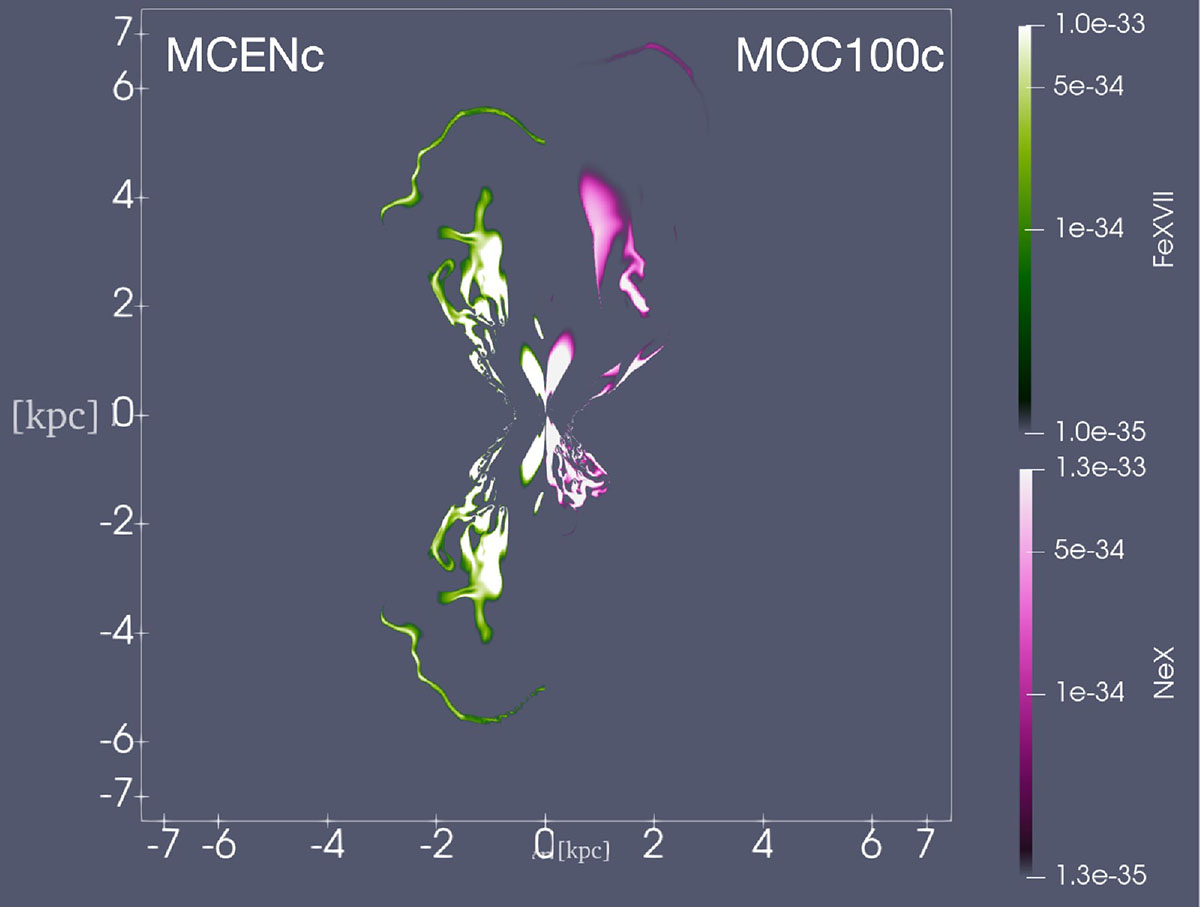
X-ray emissions for the Fe XVII line in the MCENc model (left side) and the Ne X line for the MOC100c model (right side), both at a time of 4 Myr.
Current usage metrics show cumulative count of Article Views (full-text article views including HTML views, PDF and ePub downloads, according to the available data) and Abstracts Views on Vision4Press platform.
Data correspond to usage on the plateform after 2015. The current usage metrics is available 48-96 hours after online publication and is updated daily on week days.
Initial download of the metrics may take a while.