Open Access
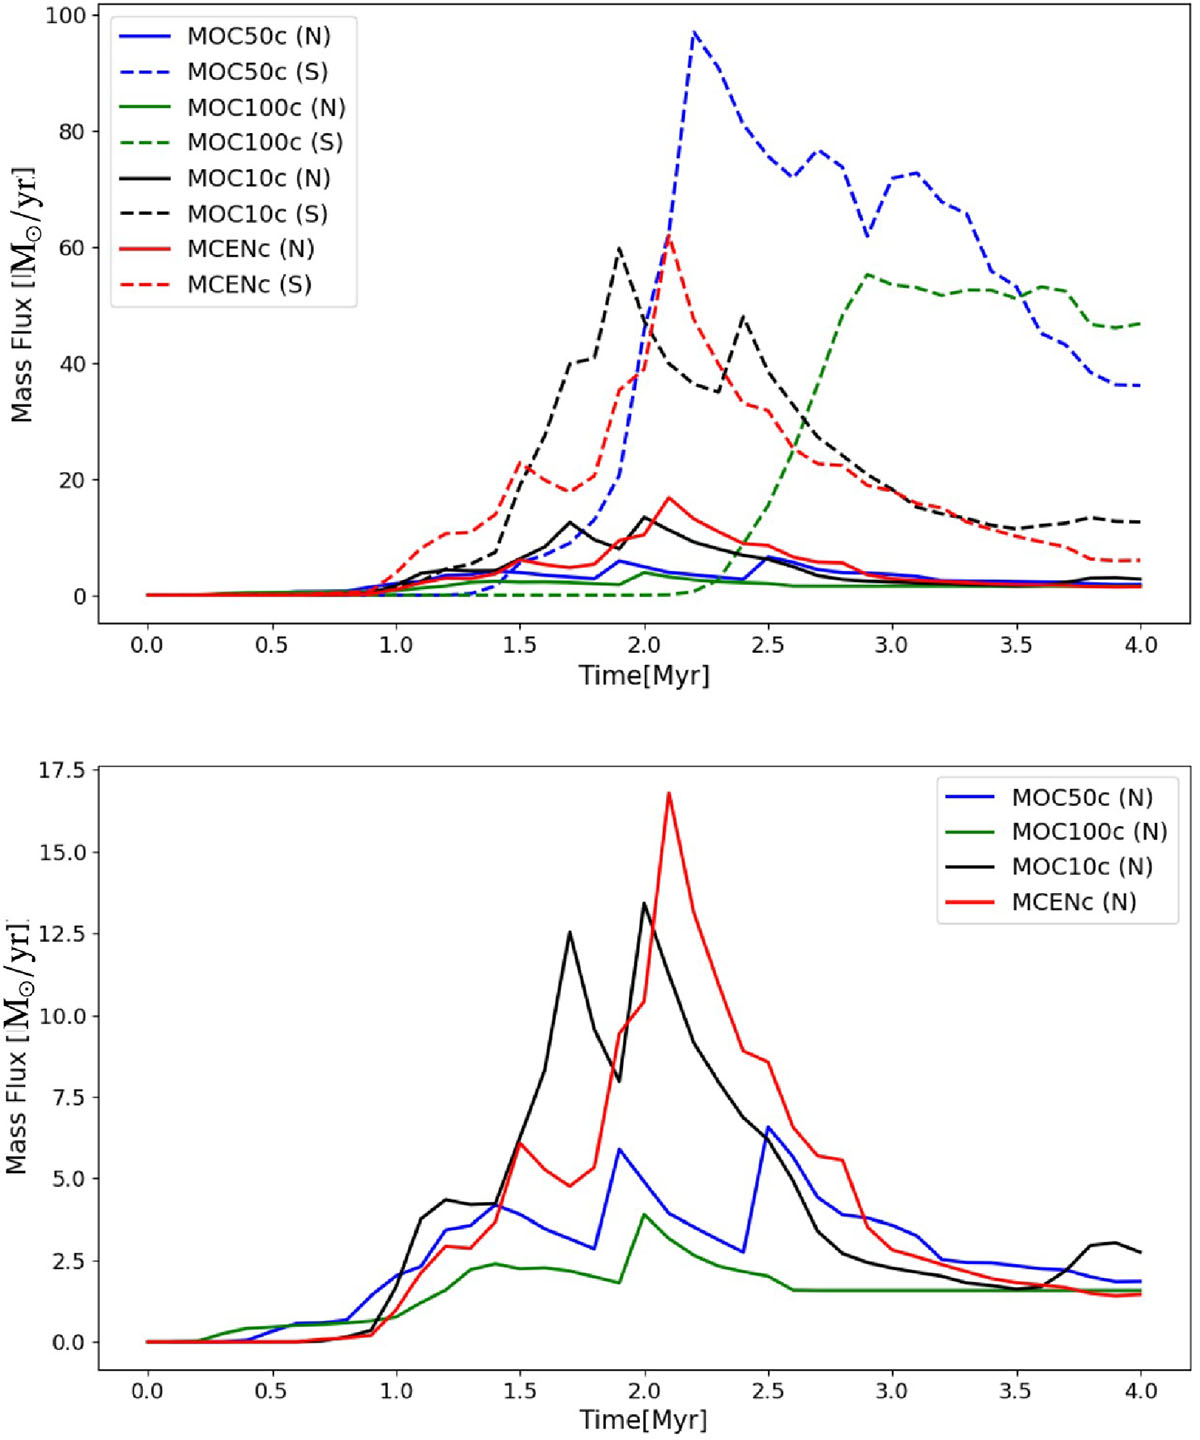
Fig. 13.
Download original image
Upper image: Mass flux against time for the northern (continuous line) and southern (dotted line) regions for the models with continuous starburst injection. Lower image: Zoom on the upper image, presenting the northern regions only.
Current usage metrics show cumulative count of Article Views (full-text article views including HTML views, PDF and ePub downloads, according to the available data) and Abstracts Views on Vision4Press platform.
Data correspond to usage on the plateform after 2015. The current usage metrics is available 48-96 hours after online publication and is updated daily on week days.
Initial download of the metrics may take a while.