Fig. 6
Download original image
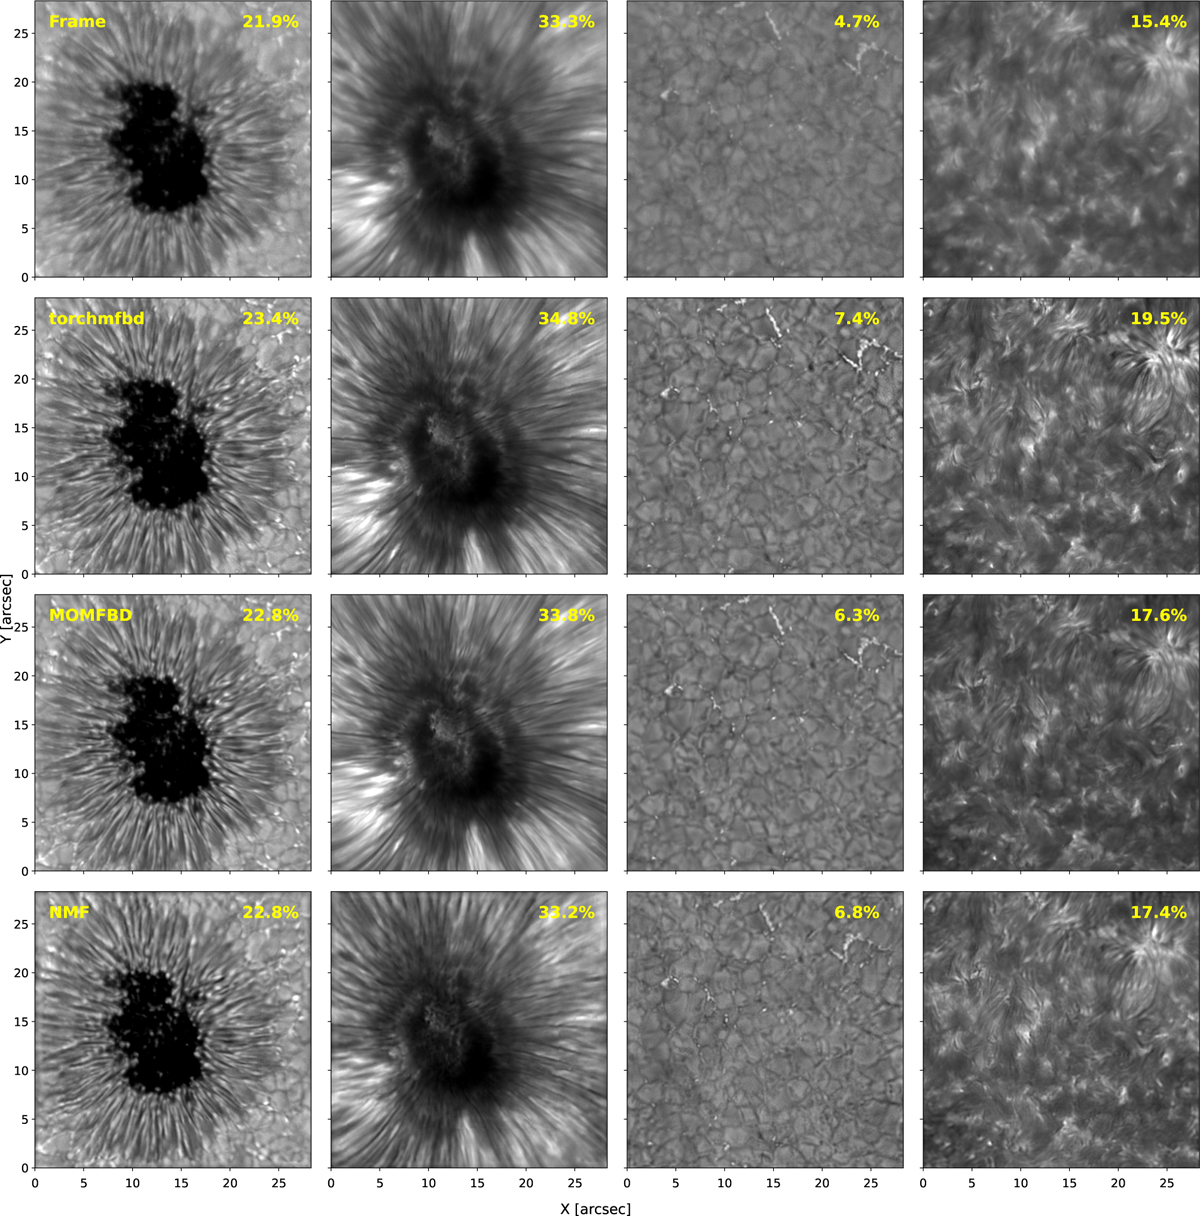
Examples of image reconstructions for data acquired in the Ca II 8542 Å line with CRISP/SST. The first row displays the best frame of the observations in terms of contrast, both for the wideband (first and third columns) and narrowband channels (second and fourth columns) for two different FoVs. The second, third, and fourth rows show the reconstructed images using torchmfbd, MOMFBD, and the experimental NMF parameterization, respectively. Hyperparameters are slightly tuned for each observation. The contrast displayed in each panel is computed over the entire image.
Current usage metrics show cumulative count of Article Views (full-text article views including HTML views, PDF and ePub downloads, according to the available data) and Abstracts Views on Vision4Press platform.
Data correspond to usage on the plateform after 2015. The current usage metrics is available 48-96 hours after online publication and is updated daily on week days.
Initial download of the metrics may take a while.