Fig. 2.
Download original image
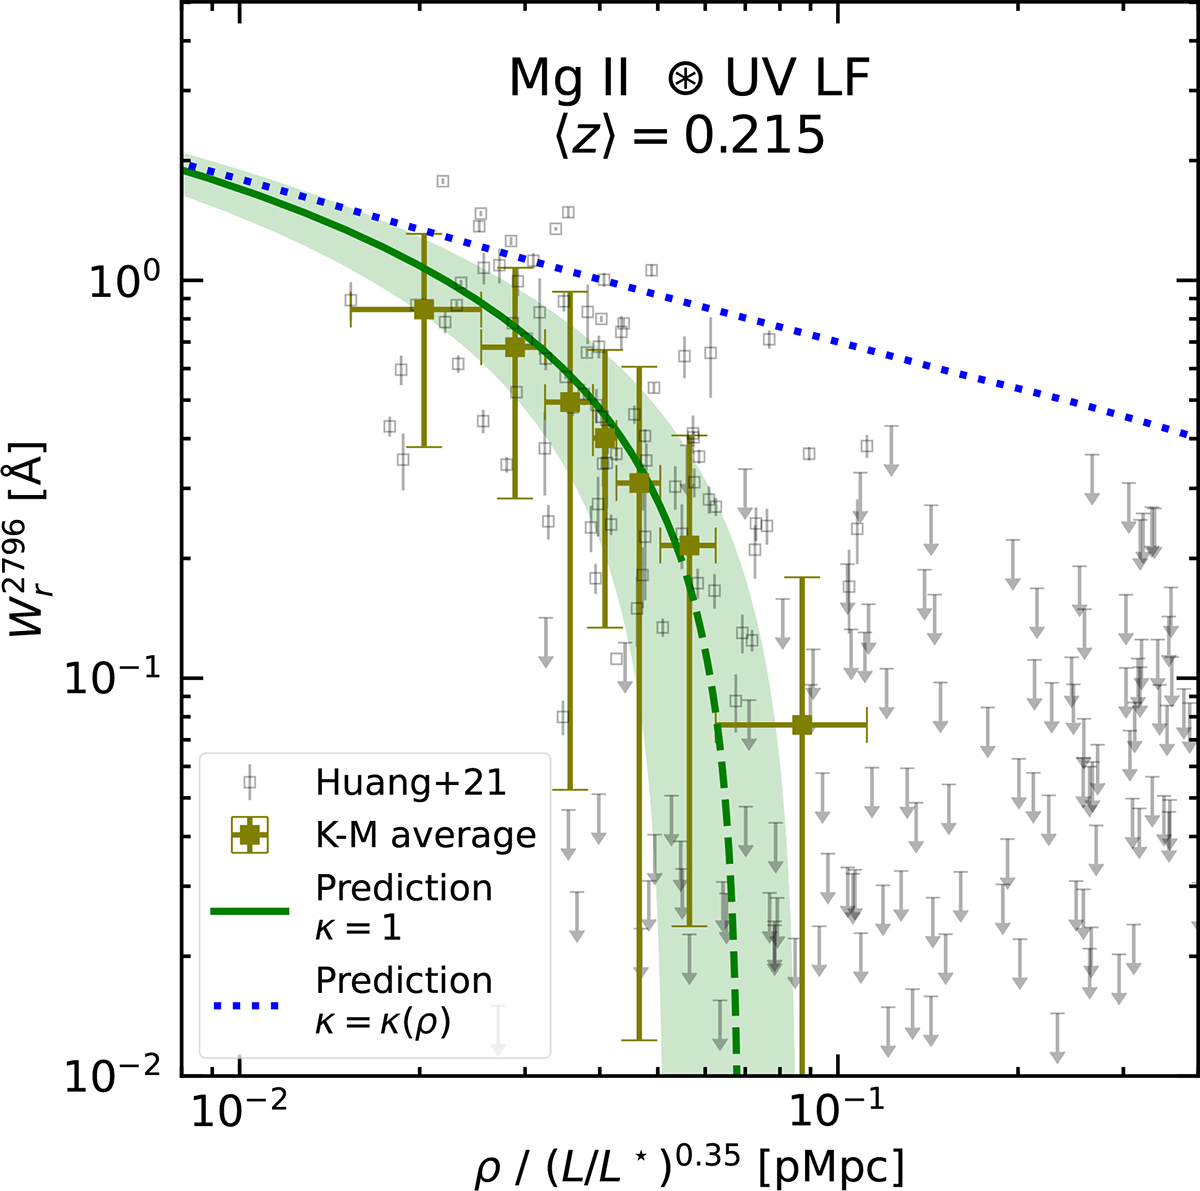
Rest-frame equivalent width of Mg II vs. projected separation of the absorbing galaxy. Black symbols represent direct data from Huang et al. (2021). Olive symbols mark average Wr values weighted by the probability distribution function (PDF) of a Kaplan-Meier estimator of detections and non-detections in the ρ-bin (details in the text). The green line shows the statistical prediction of the ![]() using Eqs. (3) and (4) for the case κ = 1. The function f(W) is taken from Zhu & Ménard (2013), extrapolated to ⟨z⟩ = 0.215, while ϕ(z, L) is from Bouwens et al. (2021) with Lmin/L⋆ = 0.03 and Lmax/L⋆ = 7.5. The shaded region propagates measurement errors of both statistics. The green dashed portion indicates the weak-Mg II regime where f(W) is incomplete. The dotted blue line shows the statistical prediction of
using Eqs. (3) and (4) for the case κ = 1. The function f(W) is taken from Zhu & Ménard (2013), extrapolated to ⟨z⟩ = 0.215, while ϕ(z, L) is from Bouwens et al. (2021) with Lmin/L⋆ = 0.03 and Lmax/L⋆ = 7.5. The shaded region propagates measurement errors of both statistics. The green dashed portion indicates the weak-Mg II regime where f(W) is incomplete. The dotted blue line shows the statistical prediction of ![]() , applying a low-redshift extrapolation of κ = κ(ρ) proposed by Schroetter et al. (2021) to model an independent data set.
, applying a low-redshift extrapolation of κ = κ(ρ) proposed by Schroetter et al. (2021) to model an independent data set.
Current usage metrics show cumulative count of Article Views (full-text article views including HTML views, PDF and ePub downloads, according to the available data) and Abstracts Views on Vision4Press platform.
Data correspond to usage on the plateform after 2015. The current usage metrics is available 48-96 hours after online publication and is updated daily on week days.
Initial download of the metrics may take a while.