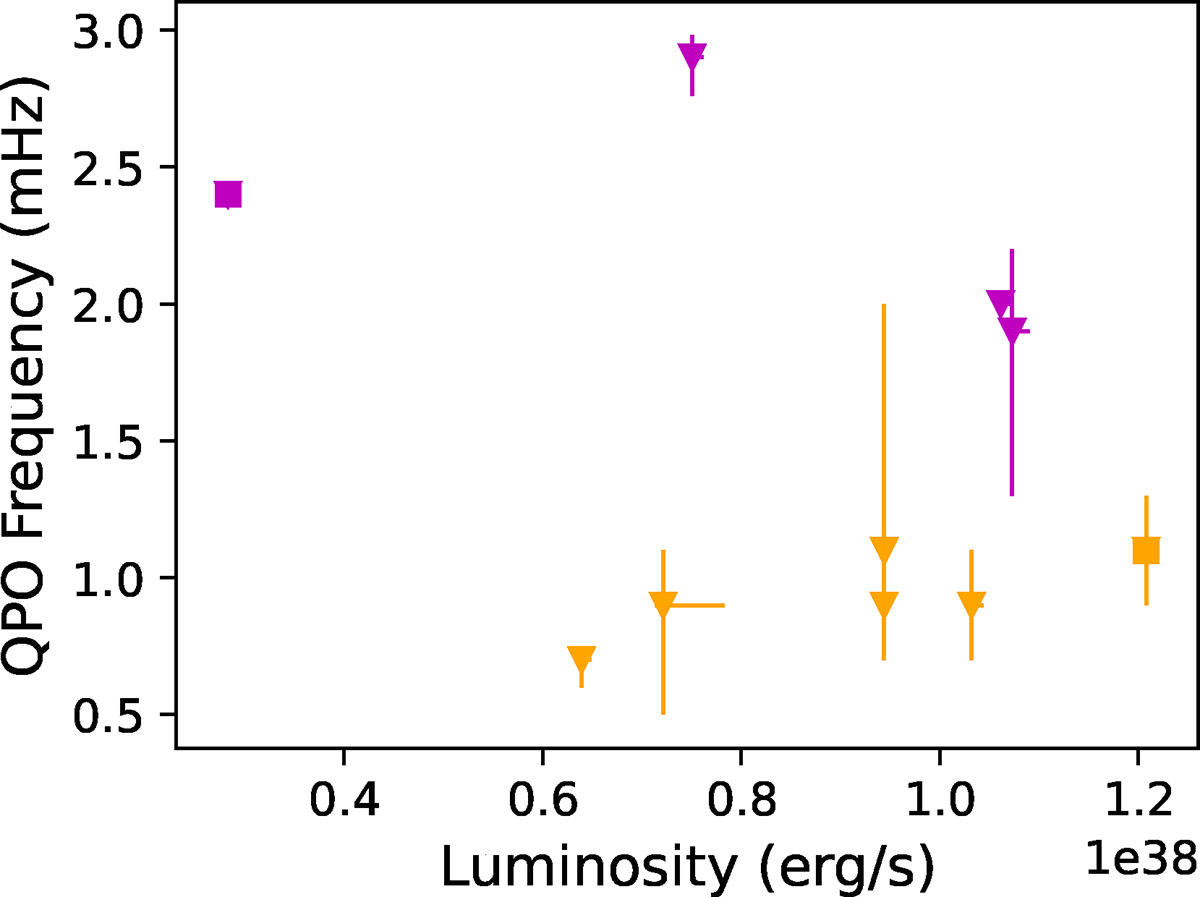
Fig. 7.
Download original image
QPO frequency as a function of luminosity. Purple and orange represent the ∼2 mHz QPO and ∼1 mHz QPO, respectively. The inverted triangles correspond to data from Roy et al. (2019), while the squares represent the results of this study. We excluded the ∼2 mHz data point from Roy et al. (2019) in cases where ∼2 mHz and ∼1 mHz QPOs were detected simultaneously in a single power spectrum, as they likely represent harmonic components.
Current usage metrics show cumulative count of Article Views (full-text article views including HTML views, PDF and ePub downloads, according to the available data) and Abstracts Views on Vision4Press platform.
Data correspond to usage on the plateform after 2015. The current usage metrics is available 48-96 hours after online publication and is updated daily on week days.
Initial download of the metrics may take a while.