| Issue |
A&A
Volume 703, November 2025
|
|
|---|---|---|
| Article Number | A124 | |
| Number of page(s) | 9 | |
| Section | Astrophysical processes | |
| DOI | https://doi.org/10.1051/0004-6361/202555558 | |
| Published online | 13 November 2025 | |
Study of millihertz quasiperiodic oscillations in the 2023 outburst of 4U 0115+63 using NuSTAR
1
Key Laboratory of Particle Astrophysics, Institute of High Energy Physics, Chinese Academy of Sciences, Beijing 100049, China
2
University of Chinese Academy of Sciences, Chinese Academy of Sciences, Beijing 100049, China
3
School of Physics and Astronomy, University of Southampton, Highfield, Southampton SO17 1BJ, UK
⋆ Corresponding author: This email address is being protected from spambots. You need JavaScript enabled to view it.
Received:
17
May
2025
Accepted:
25
August
2025
Abstract
The Be/X-ray binary 4U 0115+63 underwent a Type II giant outburst in 2023, reaching a peak luminosity of ∼1038 erg s−1. We analyzed two NuSTAR observations, one during a high state and one during a low state. The high-state data reveal quasiperiodic oscillations (QPOs) at 1.1 ± 0.2 mHz and 71.9+11.4−10.6 mHz, while the low-state data show peaks at 2.4 ± 0.2 mHz, 8.1+0.6−0.5 mHz, and 67.6+3.3−3.5 mHz. Focusing on the ∼1 mHz and ∼2 mHz QPOs, we found no significant correlation between their frequencies and luminosity. Common models such as the beat frequency model, Keplerian frequency model, disk precession, and disk thermal instability failed to explain these QPOs. Additionally, the energy dependence of the two QPOs differed: the rms of ∼1 mHz QPO decreased with energy below 10 keV and then increased, and its phase-resolved spectra softened at the peak phase. In contrast, the rms of ∼2 mHz QPO remained stable, and its spectra exhibited no phase-dependent variations. This suggests that the two QPOs are driven by different physical (albeit unknown) mechanisms.
Key words: accretion / accretion disks / pulsars: general / pulsars: individual: 4U 0115+63
© The Authors 2025
 Open Access article, published by EDP Sciences, under the terms of the Creative Commons Attribution License (https://creativecommons.org/licenses/by/4.0), which permits unrestricted use, distribution, and reproduction in any medium, provided the original work is properly cited.
This article is published in open access under the Subscribe to Open model. This email address is being protected from spambots. You need JavaScript enabled to view it. to support open access publication.
1. Introduction
Neutron star high-mass X-ray binaries are divided into Be/X-ray binaries (BeXBs) and supergiant X-ray binaries (see reviews by Reig 2011; Mushtukov & Tsygankov 2022). BeXBs, which feature a dwarf, subgiant, or giant OBe star as the optical companion, are the most numerous class. These systems exhibit one of two accretion behaviors: persistent emission at LX ∼ 1034 − 36 erg s−1 or transient activity with quiescent luminosities below ∼1034 erg s−1. The active phases include two types of outbursts: Type I X-ray outbursts are periodic and coincide with periastron passage, with a typical luminosity of LX ∼ 1036 − 37 erg s−1. Type II X-ray outbursts occur much less frequently but have a higher luminosity of LX ≳ 1037 erg s−1 and show no orbital modulation.
4U 0115+63 is one of the more active transients in the BeXB category. It was discovered during the Uhuru mission sky survey in 1972 (Giacconi et al. 1972) and has since been observed to undergo outbursts almost every few years (Yamamoto et al. 2011; Nakajima et al. 2016, 2023). Based on extensive observational data, the pulsation period and orbital period of 4U 0115+63 are estimated to be 3.6 s and 24.3 d, respectively (Rappaport et al. 1978). The distance to the source is typically assumed to be 7 kpc (Okazaki & Negueruela 2001; Gaia Collaboration 2018).
In the spectra of 4U 0115+63, five cyclotron resonant scattering features (CRSFs) were reported in the spectrum, at ∼11.2, 22.9, 32.6, 40.8, and 53 keV (Wheaton et al. 1979; White et al. 1983; Ferrigno et al. 2009). White et al. (1983) suggested that the CRSF at ∼20 keV was the second harmonic resonance. Using 11 keV as the fundamental line energy, the magnetic field of 4U 0115+63 was inferred to be ∼1012 G. Subsequently, Heindl et al. (1999) and Santangelo et al. (1999) independently discovered the presence of multiple harmonic lines using data from the Rossi X-ray Timing Explorer (RXTE) and BeppoSAX, respectively. However, Iyer et al. (2015) used a modified continuum model and detected two lines near 12 and 15 keV in RXTE and Suzaku data. Follow-up observations during the 2015 and 2023 outbursts using the Nuclear Spectroscopic Telescope Array (NuSTAR) confirmed the presence of two fundamental CRSFs at ∼12 and 16 keV, as reported by Liu et al. (2020) and Roy et al. (2024).
In timing analyses, multiple quasiperiodic oscillations (QPOs) at different frequencies have been found in the light curve of 4U 0115+63, and multiple QPOs were even observed in one observation. Soong & Swank (1989) first detected a broad QPO peak at ∼62 mHz using High Energy Astronomy Observatory 1 (HEAO 1) data. During the March 1999 outburst, Heindl et al. (1999) reported a strong 2 mHz QPO and considered that it was most likely due to the obscuration of the neutron star by hot accretion disk matter. Dugair et al. (2013) analyzed a total of 95 publicly available RXTE observations for 4U 0115+63 during three outbursts and detected a ∼41 mHz QPO, as well as the previously reported ∼2 mHz and ∼62 mHz QPOs. There was no correlation between these QPO parameters and the flux. Subsequently, Roy et al. (2019) found a lower-frequency ∼1 mHz intensity oscillation from Large Area X-ray Proportional Counter (LAXPC) observations of 4U 0115+63 in October 2015 and investigated the luminosity and energy dependence of the QPO. Additionally, a ∼10 mHz QPO was detected in 4U 0115+63 during the 2017 outburst using Insight-Hard X-ray Modulation Telescope (Insight-HXMT) data (Ding et al. 2021).
Overall, 4U 0115+63 is a unique source, with multiple CRSFs detected in its spectrum and multiple frequency modulations observed in its light curve. The lowest QPO frequency is ∼1 mHz, which is prominently visible in the light curve. However, due to its transient nature and long period, high signal-to-noise ratio and wide energy range data have been scarce, resulting in insufficient studies of the ∼1 mHz QPO. As the lowest-millihertz QPO reported in BeXBs to date, the ∼1 mHz QPO provides valuable insights into the large-scale structural evolution of the accretion flow. In this work we performed timing analysis on two observations of the 2023 outburst of 4U 0115+63 by NuSTAR. We find a ∼ 1 mHz QPO in the high-state data and a ∼2 mHz QPO in the low-state data, indicating that these two QPO frequencies are independent and not harmonic. Additionally, the long period allowed us to analyze phase-resolved spectra of the QPOs, thereby establishing a connection between the QPOs and the spectra, particularly with Fe lines and CRSFs. This may help us constrain the origin of the QPOs. Details of the analysis methods and results are presented in Sect. 3, and discussions and conclusions in Sects. 4 and 5, respectively.
2. Observations and data reduction
NuSTAR made two observations during the 2023 outburst of 4U 0115+63, with ObsIDs 90902316002 and 90902316004, hereafter referred to as Obs. 1 and Obs. 2, respectively. The first observation was made on April 9, 2023 (MJD 60043), with a total exposure time of 25342 s. The second observation was made on April 26, 2023 (MJD 60060), with a total exposure time of 33376 s.
NuSTAR is the first focusing high-energy X-ray mission that contains two detector units (FPMA and FPMB), allowing imaging of the sky in the energy range 3−79 keV (Harrison et al. 2013). NuSTAR Data Analysis Software (NuSTARDAS) is integrated in HEASoft. We used the HEASoft v6.33.2 and the NuSTAR calibration database (CALDB v20240729). In this work, all data were calibrated and screened to obtain clean events using the nupipeline script. The keyword STATUEXPR is set to be STATUS==b0000xxx00xx0000. Subsequently, DS9 was utilized to generate source extraction and background region files, followed by the application of the nuproducts command to extract source spectra and light curves. During this process, barycenter correction was applied by setting write_baryevtfile=yes and barycorr=yes. Light curves in different energy bands were extracted by setting the parameters pilow and pihigh.
3. Analysis and results
3.1. Light curve and hardness ratio
NuSTAR conducted two observations of the peak and decay phases of the 2023 outburst of 4U 0115+63. Figure 1 displays the light curve and hardness ratio (HR) from the two observations with a bin size of 50 s. HR is defined as the ratio of the 6−20 keV to the 3−6 keV count rate. In the upper panel of Fig. 1, the count rate of 4U 0115+63 fluctuates between ∼400−600 cts/s, and HR decreases by ∼10% when the count rate is high. Notably, when the source brightness is faint, there is less correlation between the count rate and hardness, as shown in the zoomed insert in the lower panel of Fig. 1. Moreover, both light curves in Fig. 1 exhibit significant modulation, which prompted us to conduct a detailed timing analysis.
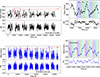 |
Fig. 1. X-ray light curves (with 50 s bins) and HRs of 4U 0115 + 63 during the 2023 outburst from Obs. 1 (upper panel) and Obs. 2 (lower panel). The HR is 6−20 keV versus 3−6 keV. The insert shows the details of the light curve. Different colors represent the different phases used for spectral analysis in Sect. 3.4. |
3.2. Search for QPOs
The most common method in timing analysis is to generate power density spectra (PDSs) from light curves to search for potential quasi-periodic signals. We generated dead-time-corrected average PDSs for the 3−78 keV light curves (bin size = 0.25 s) of both NuSTAR observations using the Fourier amplitude difference correction (Bachetti & Huppenkothen 2018) in Stingray (Bachetti et al. 2022). For the segment size, we aimed for larger values, especially for Obs. 1, as it exhibited modulation of ∼1000 s in the light curve. However, due to satellite observation constraints, the longest uninterrupted data segment is ∼3000 s. Therefore, we set the segment length to 3000 s for Obs. 1 and 2048 s for Obs. 2. The power was normalized using fractional rms-squared normalization, also known as Miyamoto normalization (Belloni & Hasinger 1990). As shown in the upper panel of Fig. 2, the PDS of Obs. 1 has two broad peaks, while the PDS of Obs. 2 has three narrower peaks.
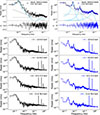 |
Fig. 2. Left panels (ObsID 90902316002), top to bottom: Miyamoto-normalized PDS, residuals of the PDS fitting, and PDSs in the 3−6 keV, 6.0−8.5 keV, 8.5−13.0 keV, and 13.0−78 keV bands. In the top panel, the cyan curves show the Lorentzian components, and the gray curves the power-law components of the fitted model. Only the PSD below 0.2 Hz is modeled; above this frequency the neutron-star spin frequency and its harmonics dominate. Right panels: Same but for ObsID 90902316004. |
To quantify the properties of each peak, we fitted them using a Lorentzian model in XSPEC and also used a power-law model to account for Poisson noise and band-limited noise. We calculated the quality factor and the fractional rms amplitude for each Lorentzian component, which are defined as follows: Q = ν0/FWHM and rms =  (van der Klis 1989; Belloni & Hasinger 1990). The results are listed in Table 1. Due to the close frequency and broad peak, the center frequency of the rightmost peak (ν3) in the PDSs of Obs. 1 (high state) and Obs. 2 (low state) is ∼70 mHz, possibly corresponding to the QPO peak at ∼62 mHz reported by Soong & Swank (1989) during the 1978 outburst. The center frequencies of the leftmost peaks (ν1) in the PDSs are 1.1 ± 0.2 mHz and 2.4 ± 0.2 mHz, consistent with the modulations seen in Fig. 1. Furthermore, Obs. 2 exhibits a peak (ν2) at
  mHz, which may be a harmonic of ν1 or an additional QPO, but this cannot be conclusively determined.
Lorentzian fitting parameters for the PDS.
It is worth noting that the modulation in the light curve in the upper panel of Fig. 1 appears significant, but ∼1 mHz QPO peak in the PDS of Obs. 1 is quite broad. This is because the frequency resolution of the PDS is limited by the time window of the space observations (VanderPlas 2018). Therefore, we also computed the Lomb-Scargle periodogram for the entire light curve of the observation, which is an algorithm specifically designed to detect and characterize periodic signals in unevenly sampled data (Lomb 1976; Scargle 1982). The frequencies detected in Obs. 1 and Obs. 2 are 0.9 mHz and 2.1 mHz, respectively, as shown in Fig. A.1. These frequencies are consistent with the central frequencies obtained by fitting the PDSs with a Lorentzian function, further confirming the presence of the QPO in the data. In Fig. A.1, the other strong peaks besides the highest one are due to signal aliasing caused by the observation gaps.
3.3. Energy dependence of QPO
To investigate the energy dependence of the QPO feature, we generated PDSs in the four energy bands of 3−6 keV, 6−8.5 keV, 8.5−13 keV, and 13−78 keV. As shown in the lower panel of Fig. 2, the ν3 in Obs. 1 is very weak in the PDSs across different energy bands, so we did not calculate its rms further. For Obs. 1, the rms of ν1 decreases with energy, from ∼8% in the 3−6 keV band to ∼4% in the 8.5−13 keV band. Above 13 keV, the rms increases again to ∼6%, as shown in Fig. 3. However, for the three QPOs in Obs. 2, the rms does not show a significant change with energy. Below, we discuss these properties in detail.
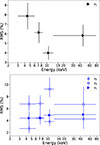 |
Fig. 3. QPO rms variation with energy from Obs. 1 (upper panel) and Obs. 2 (lower panel). |
3.4. Phase-resolved spectra of QPO
Typically, the phase-resolved spectra is to divide the observed data according to the different phases of the neutron star pulse period and perform independent spectral analysis of the data for each phase segment. In this work we applied phase-resolved analysis to ∼2 mHz QPO in Obs. 2 using variational mode decomposition (VMD) and Hilbert spectral analysis to reveal spectral variations at different phases (see reviews by Huang et al. 1998; Huang & Wu 2008; Dragomiretskiy & Zosso 2014). Mode decomposition separates a time series into multiple intrinsic mode functions (IMFs), expressed as
 (1)
(1)
where Ak(t) and ϕk(t) are the instantaneous amplitude and phase of the k-th IMF, respectively. For a time series f(t), the Hilbert transform is applied using
 (2)
(2)
to obtain the corresponding analytic signal, which is defined as
 (3)
(3)
where j is the imaginary unit. The time-dependent amplitude A(t) and phase ϕ(t) can be obtained from the analytic signal.
However, the modulation period in Obs. 1 is ∼1000 s, a good time interval contains fewer than three cycles, and the modulation curve is very irregular, so there is a high likelihood that the modes decomposed via VMD deviate from the true QPO modulation. Therefore, we selected a segment of the light curve with clear modulation, as shown in the zoomed insert of Fig. 1. We divided this segment into three intervals (P1, P2, and P3), each represented by different colors, and extracted the spectra for each interval. The spectra were re-binned to have at least 50 counts per energy bin using the task grppha. Subsequently, we fitted the 3−40 keV spectra for each phase in XSPEC using the model const×TBabs×gabs×gabs×(comptt+gaussian). The abundances were set to WILM (Wilms et al. 2000), and the cross sections to VERN (Verner et al. 1996). Since the NuSTAR data do not cover energies below 3 keV, the hydrogen column density (NH) in Tbabs was fixed at 1.3 × 1022 cm−2, as obtained from the broadband joint spectra of Suzaku and RXTE (Iyer et al. 2015). Additionally, we tested other values and found that even doubling or halving NH had little impact on the fit results, and the χ2 value increased by less than 20. The two gabs components were used to describe the cyclotron absorption feature at around 10 keV and its harmonic, while a gaussian component was used to model the iron emission line around 6.4 keV. The detailed spectral parameters are listed in Table 2 and the evolution of these parameters with phase is shown in Fig. 4. From Fig. 4, it can be seen that the width and depth of the two cyclotron absorption lines exhibit opposite trends.
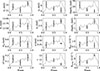 |
Fig. 4. Variation in spectral parameters with phase for Obs. 1, including the central energy (E1/E2), width (σ1/σ2), and depth (Depth1/Depth2) of the cyclotron absorption line (and its harmonics), the central energy (EFe), line width (σ), and normalization (Ngau) of the iron line, and the plasma temperature (kT), plasma optical depth (τ), and normalization (Ncomp) of the compTT component. The gray line represents the average profile of the data used for the phase-resolved spectral analysis. The triangles indicate the upper limits. |
Best-fitting spectral parameters of the NuSTAR observations of 4U 0115+63.
In Obs. 2 we selected two good time intervals with clear modulation and performed mode decomposition using the Python package vmdpy (Carvalho et al. 2020). Figure 5 shows an example of a 3300 s long light curve along with its corresponding QPO IMF. Subsequently, we applied the Hilbert transform to the QPO IMF to obtain the instantaneous phases. We divided one period into five bins and extracted the spectra for each bin based on the phase function. The spectral fitting for each bin is same as the method used for Obs. 1, except that a Gaussian component was removed due to the weak iron line emission. The evolution of the spectral parameters with phase is shown in Fig. 6. Except for the normalization (Ncomp) of the compTT component, the spectral parameters do not show significant evolution with phase. This is consistent with the hardness behavior shown in the lower panel of Fig. 1.
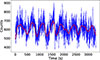 |
Fig. 5. Example of a 3300 s long light curve (blue dots) of Obs. 2 along with its corresponding QPO IMF (solid red line). |
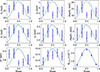 |
Fig. 6. Variation in spectral parameters with phase for Obs. 2, including the central energy (E1, E2), width (σ1, σ2), and depth (Depth1, Depth2) of the cyclotron absorption line (and its harmonics) and the plasma temperature (kT), plasma optical depth (τ), and normalization (Ncomp) of the compTT component. The solid sky-blue line represents the QPO waveform from the Hilbert spectral analysis phase-folding. |
4. Discussion
High magnetic field neutron star systems show only low-frequency broad QPO peaks, in the range 1 mHz to about 1 Hz (see Devasia et al. 2011, and references therein). Most QPOs are transient and even in persistent sources (see, e.g., Angelini et al. 1991; Liu et al. 2022; Sharma et al. 2023), they are not always observed. However, in some transient sources, such as 1A 0535+262 (Ma et al. 2022), 1A 1118−61 (Devasia et al. 2011), and XTE J1858+034 (Mukherjee et al. 2006), QPOs have been detected more frequently. These millihertz QPOs are generally thought to be related to the rotation of the inner accretion disk. Beat frequency model (BFM) and Keplerian frequency model (KFM) are the two most widely applied models: The BFM posits that the QPO frequency arises from the beat frequency modulation between the orbital frequency (νk) of the inner accretion disk and the spin frequency (νspin) of the neutron star (Alpar & Shaham 1985). In contrast, the KFM suggests that QPOs arise from periodic obscuration of the accretion column radiation by the inner accretion disk (van der Klis et al. 1987). Both models predict a positive correlation between QPO frequency and accretion rate. Although this relationship has been observed in some sources (see, e.g., Finger et al. 1996; Devasia et al. 2011), it is important to note that in the majority sources, no such variation in QPO frequency with accretion rate has been detected (see, e.g., Qu et al. 2005; James et al. 2010).
Multiple QPOs can appear simultaneously in a single light curve of 4U 0115+63, as reported in previous studies (Dugair et al. 2013; Roy et al. 2019; Ding et al. 2021). Currently, no clear correlation has been established between the QPO occurrence and luminosity. We report the analysis of NuSTAR data from the 2023 outburst of 4U 0115+63, where we observe two QPOs at frequencies of 1.1 ± 0.2 mHz and  mHz in the high state, and three QPOs at frequencies of 2.4 ± 0.2 mHz,
  mHz, and
  mHz in the low state. All these QPOs (except the 8.1 mHz QPO) have been observed in previous outbursts. Notably, the flux and rms values of the ∼2 and ∼62 mHz QPOs – observed simultaneously in our low-state data – show approximate consistency with those concurrently detected in the 2004 RXTE data by Dugair et al. (2013). However, whether this consistency indicates a genuine physical correlation requires further observational verification. The
  mHz feature might correspond to the 10 mHz peak reported by Ding et al. (2021). Regrettably, the short good time interval of the Insight-HXMT data precludes the confirmation of potential signals near ∼2 mHz. Furthermore, our power spectrum analysis reveals no detections of the 41 mHz QPO (Dugair et al. 2013), or the 4 mHz and 14.9 mHz QPOs (Ding et al. 2021).
We primarily focused on the ∼1 mHz and ∼2 mHz QPOs, which show clear modulation in the light curve. In this work, these two QPOs ware detected separately in two observations during a outburst, rather than exhibiting a harmonic relationship. This naturally raises the question of whether these QPOs originate from the same mechanism operating at different luminosities. To address this, by combing with past reports (Roy et al. 2019), we present the relationships between frequency and luminosity for ∼1 mHz and 2 mHz QPOs, respectively. As shown in Fig. 7, despite the detection of both ∼1 mHz and ∼2 mHz QPOs at comparable luminosity levels, their frequency evolution with respect to luminosity exhibits distinct characteristics. Additionally, the energy dependence of the rms of the two QPOs differs: the rms of ∼1 mHz QPO decreases with energy and then increases above 10 keV, while the rms of ∼2 mHz QPO does not show any significant evolution with energy (see Fig. 3). This further suggests that the two QPOs do not originate from the same mechanism.
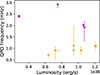 |
Fig. 7. QPO frequency as a function of luminosity. Purple and orange represent the ∼2 mHz QPO and ∼1 mHz QPO, respectively. The inverted triangles correspond to data from Roy et al. (2019), while the squares represent the results of this study. We excluded the ∼2 mHz data point from Roy et al. (2019) in cases where ∼2 mHz and ∼1 mHz QPOs were detected simultaneously in a single power spectrum, as they likely represent harmonic components. |
Moreover, our findings indicate that there is no positive correlation between frequency and luminosity for each QPO (Fig. 7). Consequently, conventional models like BFM and KFM do not sufficiently account for the origin of these QPOs. Alongside these models, Roy et al. (2019) also proposed alternative mechanisms for explaining QPOs, such as the warping or precession of the accretion disk induced by the neutron star’s magnetic torque on its inner region (Frank et al. 2002), as well as the viscous relaxation timescale resulting from thermal disk instabilities (Shirakawa & Lai 2002). These mechanisms also predict a positive relationship between QPO frequency and luminosity. Thus, these models are also somewhat lacking in adequately explaining the origins of ∼1 mHz and ∼2 mHz QPOs.
We also analyzed the phase-resolved spectra of the QPOs in both observations to explore the evolution of spectral parameters at different QPO phases, particularly the cyclotron absorption lines and iron lines. In Obs. 1, the light curve modulation is asymmetric, featuring a gradual rise followed by a rapid fall (refer to Fig. 1). From Fig. 4, it can be seen that the values of the width and depth of the cyclotron absorption line at ∼10 keV are larger in the high-intensity phase (P3), while the cyclotron absorption line at ∼20 keV shows the opposite behavior. To better understand how photon counts vary across energy ranges, we compared phases P2 and P3 (Obs. 1) against P1 by plotting the count rate ratio versus energy. From the lower panel of Fig. 8, a dip is observed at ∼10 keV, whereas no such feature is present at ∼20 keV. We note that X-ray pulsars typically exhibit softer spectra at higher luminosities (see, e.g., Reig & Nespoli 2013; Li et al. 2024). Therefore, the enhancement of the CRSF at ∼10 keV is likely due to the softening of the continuum. Considering the degeneracy in fitting the ∼10 keV and ∼20 keV absorption lines, a deeper and broader ∼10 keV feature would artificially result in a shallower and narrower ∼20 keV line. In addition, we do not detect any evolution of Fe lines with QPO phase. In contrast to Obs. 1, the light curve modulation in Obs. 2 is more symmetric, and there is no significant evolution of the spectral parameters in different QPO phases (Fig. 6).
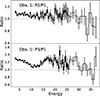 |
Fig. 8. Evolution of the count rate ratio with energy. The values represent the ratios of different energy bins in phases P2 and P3 of Obs. 1 relative to those in phase P1. |
5. Conclusion
We analyzed two observations (ObsIDs 90902316002 and 90902316004) of the 2023 outburst of 4U 0115+63, corresponding to the high and low states, using NuSTAR data. The PDS of the high-state data shows two peaks, at 1.1 ± 0.2 mHz and  mHz, while the low-state PSD shows three peaks, at 2.4 ± 0.2 mHz,
  mHz, and
  mHz. We focused on the behaviors of the ∼1 mHz and ∼2 mHz QPOs. This is the first instance where these two QPOs have been independently observed in two distinct observations during an outburst, rather than being identified as harmonic components of a single QPO.
Additionally, the two QPOs exhibited different energy dependences: The rms amplitude of the ∼1 mHz QPO decreased with energy below 10 keV, then increased at higher energies, and the phase-resolved spectra of the QPO softened during the peak phase. In contrast, the ∼2 mHz QPO displayed a stable rms amplitude across energies and showed no phase-dependent spectral variations. These results strongly suggest that the two QPOs are generated by different physical mechanisms. However, the frequencies of these two QPOs showed no significant correlation with luminosity. Common models such as the BFM, KFM, disk precession, and disk thermal instability failed to explain these QPOs, leaving their underlying physical mechanisms a puzzle.
Acknowledgments
We thank the referee for constructive suggestions that have improved the manuscript. Financial support for this work is provided by the National Key R&D Program of China (2021YFA0718500). We also acknowledge funding from the National Natural Science Foundation of China (NSFC) under grant numbers 12122306, 12333007, and U2038102.
References
- Alpar, M. A., & Shaham, J. 1985, Nature, 316, 239 [NASA ADS] [CrossRef] [Google Scholar]
- Angelini, L., Stella, L., & White, N. E. 1991, ApJ, 371, 332 [NASA ADS] [CrossRef] [Google Scholar]
- Bachetti, M., & Huppenkothen, D. 2018, ApJ, 853, L21 [Google Scholar]
- Bachetti, M., Huppenkothen, D., Khan, U., et al. 2022, https://doi.org/10.5281/zenodo.7135161 [Google Scholar]
- Belloni, T., & Hasinger, G. 1990, A&A, 230, 103 [NASA ADS] [Google Scholar]
- Carvalho, V. R., Moraes, M. F., Braga, A. P., & Mendes, E. M. 2020, Biomed. Signal Process. Control, 62, 102073 [CrossRef] [Google Scholar]
- Devasia, J., James, M., Paul, B., & Indulekha, K. 2011, MNRAS, 414, 1023 [Google Scholar]
- Ding, Y. Z., Wang, W., Zhang, P., et al. 2021, MNRAS, 503, 6045 [Google Scholar]
- Dragomiretskiy, K., & Zosso, D. 2014, IEEE Trans. Signal Process., 62, 531 [CrossRef] [Google Scholar]
- Dugair, M. R., Jaisawal, G. K., Naik, S., & Jaaffrey, S. N. A. 2013, MNRAS, 434, 2458 [Google Scholar]
- Ferrigno, C., Becker, P. A., Segreto, A., Mineo, T., & Santangelo, A. 2009, A&A, 498, 825 [NASA ADS] [CrossRef] [EDP Sciences] [Google Scholar]
- Finger, M. H., Wilson, R. B., & Harmon, B. A. 1996, ApJ, 459, 288 [NASA ADS] [CrossRef] [Google Scholar]
- Frank, J., King, A., & Raine, D. J. 2002, Accretion Power in Astrophysics: Third Edition (Cambridge: Cambridge University Press) [Google Scholar]
- Gaia Collaboration (Brown, A. G. A., et al.) 2018, A&A, 616, A1 [NASA ADS] [CrossRef] [EDP Sciences] [Google Scholar]
- Giacconi, R., Murray, S., Gursky, H., et al. 1972, ApJ, 178, 281 [NASA ADS] [CrossRef] [Google Scholar]
- Harrison, F. A., Craig, W. W., Christensen, F. E., et al. 2013, ApJ, 770, 103 [Google Scholar]
- Heindl, W. A., Coburn, W., Gruber, D. E., et al. 1999, ApJ, 521, L49 [NASA ADS] [CrossRef] [Google Scholar]
- Huang, N. E., & Wu, Z. 2008, Rev. Geophys., 46, RG2006 [CrossRef] [Google Scholar]
- Huang, N. E., Shen, Z., Long, S. R., et al. 1998, Proc. Roy. Soc. London Ser. A, 454, 903 [NASA ADS] [CrossRef] [Google Scholar]
- Iyer, N., Mukherjee, D., Dewangan, G. C., Bhattacharya, D., & Seetha, S. 2015, MNRAS, 454, 741 [NASA ADS] [CrossRef] [Google Scholar]
- James, M., Paul, B., Devasia, J., & Indulekha, K. 2010, MNRAS, 407, 285 [NASA ADS] [CrossRef] [Google Scholar]
- Li, P. P., Becker, P. A., & Tao, L. 2024, A&A, 689, A316 [NASA ADS] [CrossRef] [EDP Sciences] [Google Scholar]
- Liu, B.-S., Tao, L., Zhang, S.-N., et al. 2020, ApJ, 900, 41 [NASA ADS] [CrossRef] [Google Scholar]
- Liu, Q., Wang, W., Chen, X., et al. 2022, MNRAS, 516, 5579 [NASA ADS] [CrossRef] [Google Scholar]
- Lomb, N. R. 1976, Ap&SS, 39, 447 [Google Scholar]
- Ma, R., Tao, L., Zhang, S.-N., et al. 2022, MNRAS, 517, 1988 [Google Scholar]
- Mukherjee, U., Bapna, S., Raichur, H., Paul, B., & Jaaffrey, S. N. A. 2006, JApA, 27, 25 [Google Scholar]
- Mushtukov, A., & Tsygankov, S. 2022, ArXiv e-prints [arXiv:2204.14185] [Google Scholar]
- Nakajima, M., Sugizaki, M., Ueno, S., et al. 2016, ATel, 9149, 1 [Google Scholar]
- Nakajima, M., Mihara, T., Negoro, H., et al. 2023, ATel, 15967, 1 [Google Scholar]
- Okazaki, A. T., & Negueruela, I. 2001, A&A, 377, 161 [NASA ADS] [CrossRef] [EDP Sciences] [Google Scholar]
- Qu, J., Zhang, S., Song, L., & Falanga, M. 2005, ApJ, 629, L33 [Google Scholar]
- Rappaport, S., Clark, G. W., Cominsky, L., Joss, P. C., & Li, F. 1978, ApJ, 224, L1 [NASA ADS] [CrossRef] [Google Scholar]
- Reig, P. 2011, Ap&SS, 332, 1 [Google Scholar]
- Reig, P., & Nespoli, E. 2013, A&A, 551, A1 [NASA ADS] [CrossRef] [EDP Sciences] [Google Scholar]
- Roy, J., Agrawal, P. C., Iyer, N. K., et al. 2019, ApJ, 872, 33 [Google Scholar]
- Roy, K., Manikantan, H., & Paul, B. 2024, A&A, 690, A50 [NASA ADS] [CrossRef] [EDP Sciences] [Google Scholar]
- Santangelo, A., Segreto, A., Giarrusso, S., et al. 1999, ApJ, 523, L85 [NASA ADS] [CrossRef] [Google Scholar]
- Scargle, J. D. 1982, ApJ, 263, 835 [Google Scholar]
- Sharma, R., Jain, C., Rikame, K., & Paul, B. 2023, MNRAS, 519, 1764 [Google Scholar]
- Shirakawa, A., & Lai, D. 2002, ApJ, 565, 1134 [Google Scholar]
- Soong, Y., & Swank, J. H. 1989, ESA Spec. Publ., 1, 617 [Google Scholar]
- van der Klis, M. 1989, NATO Adv. Study Inst. (ASI) Ser. C, 262, 27 [Google Scholar]
- van der Klis, M., Stella, L., White, N., Jansen, F., & Parmar, A. N. 1987, ApJ, 316, 411 [Google Scholar]
- VanderPlas, J. T. 2018, ApJS, 236, 16 [Google Scholar]
- Verner, D. A., Ferland, G. J., Korista, K. T., & Yakovlev, D. G. 1996, ApJ, 465, 487 [Google Scholar]
- Wheaton, W. A., Doty, J. P., Primini, F. A., et al. 1979, Nature, 282, 240 [NASA ADS] [CrossRef] [Google Scholar]
- White, N. E., Swank, J. H., & Holt, S. S. 1983, ApJ, 270, 711 [NASA ADS] [CrossRef] [Google Scholar]
- Wilms, J., Allen, A., & McCray, R. 2000, ApJ, 542, 914 [Google Scholar]
- Yamamoto, T., Nakajima, M., Mihara, T., et al. 2011, ATel, 3430, 1 [Google Scholar]
Appendix A: Additional figure
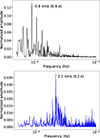 |
Fig. A.1. Upper panel: Lomb-Scargle periodogram computed from the light curve of Obs.1 with a 50 s bin. Lower panel: Lomb-Scargle periodogram computed from the light curve of Obs.2 with a 20 s bin. |
All Tables
All Figures
|
Fig. 1. X-ray light curves (with 50 s bins) and HRs of 4U 0115 + 63 during the 2023 outburst from Obs. 1 (upper panel) and Obs. 2 (lower panel). The HR is 6−20 keV versus 3−6 keV. The insert shows the details of the light curve. Different colors represent the different phases used for spectral analysis in Sect. 3.4. |
| In the text | |
|
Fig. 2. Left panels (ObsID 90902316002), top to bottom: Miyamoto-normalized PDS, residuals of the PDS fitting, and PDSs in the 3−6 keV, 6.0−8.5 keV, 8.5−13.0 keV, and 13.0−78 keV bands. In the top panel, the cyan curves show the Lorentzian components, and the gray curves the power-law components of the fitted model. Only the PSD below 0.2 Hz is modeled; above this frequency the neutron-star spin frequency and its harmonics dominate. Right panels: Same but for ObsID 90902316004. |
| In the text | |
|
Fig. 3. QPO rms variation with energy from Obs. 1 (upper panel) and Obs. 2 (lower panel). |
| In the text | |
|
Fig. 4. Variation in spectral parameters with phase for Obs. 1, including the central energy (E1/E2), width (σ1/σ2), and depth (Depth1/Depth2) of the cyclotron absorption line (and its harmonics), the central energy (EFe), line width (σ), and normalization (Ngau) of the iron line, and the plasma temperature (kT), plasma optical depth (τ), and normalization (Ncomp) of the compTT component. The gray line represents the average profile of the data used for the phase-resolved spectral analysis. The triangles indicate the upper limits. |
| In the text | |
|
Fig. 5. Example of a 3300 s long light curve (blue dots) of Obs. 2 along with its corresponding QPO IMF (solid red line). |
| In the text | |
|
Fig. 6. Variation in spectral parameters with phase for Obs. 2, including the central energy (E1, E2), width (σ1, σ2), and depth (Depth1, Depth2) of the cyclotron absorption line (and its harmonics) and the plasma temperature (kT), plasma optical depth (τ), and normalization (Ncomp) of the compTT component. The solid sky-blue line represents the QPO waveform from the Hilbert spectral analysis phase-folding. |
| In the text | |
|
Fig. 7. QPO frequency as a function of luminosity. Purple and orange represent the ∼2 mHz QPO and ∼1 mHz QPO, respectively. The inverted triangles correspond to data from Roy et al. (2019), while the squares represent the results of this study. We excluded the ∼2 mHz data point from Roy et al. (2019) in cases where ∼2 mHz and ∼1 mHz QPOs were detected simultaneously in a single power spectrum, as they likely represent harmonic components. |
| In the text | |
|
Fig. 8. Evolution of the count rate ratio with energy. The values represent the ratios of different energy bins in phases P2 and P3 of Obs. 1 relative to those in phase P1. |
| In the text | |
|
Fig. A.1. Upper panel: Lomb-Scargle periodogram computed from the light curve of Obs.1 with a 50 s bin. Lower panel: Lomb-Scargle periodogram computed from the light curve of Obs.2 with a 20 s bin. |
| In the text | |
Current usage metrics show cumulative count of Article Views (full-text article views including HTML views, PDF and ePub downloads, according to the available data) and Abstracts Views on Vision4Press platform.
Data correspond to usage on the plateform after 2015. The current usage metrics is available 48-96 hours after online publication and is updated daily on week days.
Initial download of the metrics may take a while.