Fig. 2.
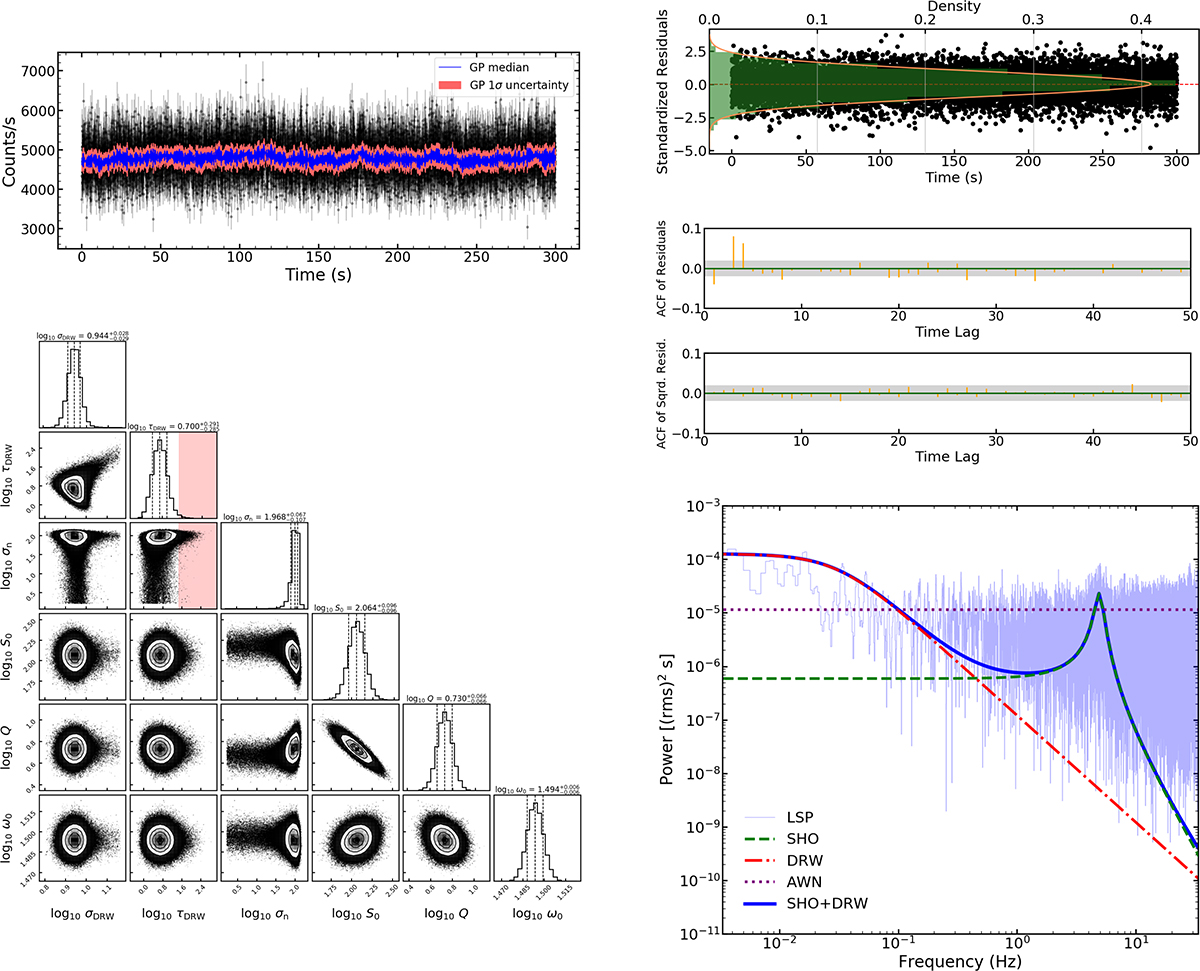
Download original image
LE fitting results when Q is free. Left column, from top to bottom: Light curve fitting results (including the mean prediction from the GP model and the 1σ uncertainty range corresponding to the total kernel) and parameter corner plot. Right column, from top to bottom: Residual distribution, ACF, and PSD. In PSD plot the blue line in the background represents the LSP, and the darker blue line is the total PSD of SHO (green line) and DRW (red line). The AWN term is plotted with the dotted purple line.
Current usage metrics show cumulative count of Article Views (full-text article views including HTML views, PDF and ePub downloads, according to the available data) and Abstracts Views on Vision4Press platform.
Data correspond to usage on the plateform after 2015. The current usage metrics is available 48-96 hours after online publication and is updated daily on week days.
Initial download of the metrics may take a while.